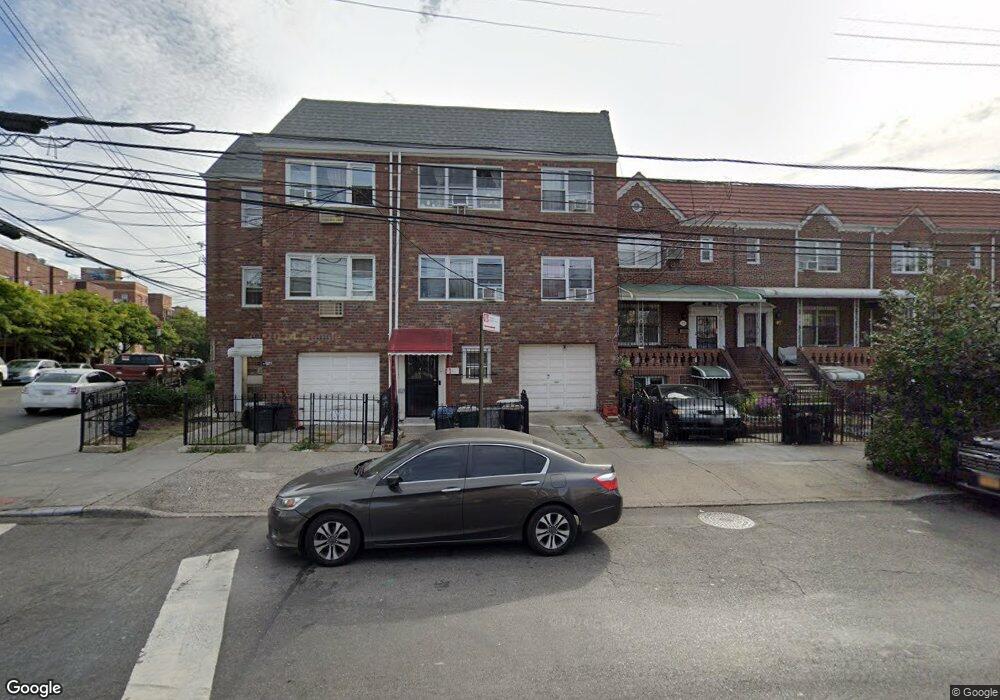
5003 Junction Blvd Elmhurst, NY 11373
Corona NeighborhoodEstimated Value: $1,266,805 - $1,772,000
Studio
--
Bath
2,925
Sq Ft
$532/Sq Ft
Est. Value
About This Home
This home is located at 5003 Junction Blvd, Elmhurst, NY 11373 and is currently estimated at $1,556,701, approximately $532 per square foot. 5003 Junction Blvd is a home located in Queens County with nearby schools including Elm Tree Elementary School, I.S. 093 Ridgewood, and Joseph F. Quinn Intermediate School 77.
Ownership History
Date
Name
Owned For
Owner Type
Purchase Details
Closed on
Nov 19, 2015
Sold by
Chow Fung and Yu Hui En
Bought by
Chow Fung and Chow Wun
Current Estimated Value
Purchase Details
Closed on
Apr 12, 2004
Sold by
Zhan Sui Jiao
Bought by
Chow Fung
Home Financials for this Owner
Home Financials are based on the most recent Mortgage that was taken out on this home.
Original Mortgage
$38,500
Interest Rate
5.4%
Purchase Details
Closed on
Jan 10, 1997
Sold by
Chan Tor and He Shirley
Bought by
Zhan Sui Jiao
Home Financials for this Owner
Home Financials are based on the most recent Mortgage that was taken out on this home.
Original Mortgage
$180,000
Interest Rate
7.78%
Create a Home Valuation Report for This Property
The Home Valuation Report is an in-depth analysis detailing your home's value as well as a comparison with similar homes in the area
Home Values in the Area
Average Home Value in this Area
Purchase History
| Date | Buyer | Sale Price | Title Company |
|---|---|---|---|
| Chow Fung | -- | -- | |
| Chow Fung | -- | -- | |
| Chow Fung | $665,000 | -- | |
| Chow Fung | $665,000 | -- | |
| Zhan Sui Jiao | $270,000 | First American Title Ins Co | |
| Zhan Sui Jiao | $270,000 | First American Title Ins Co |
Source: Public Records
Mortgage History
| Date | Status | Borrower | Loan Amount |
|---|---|---|---|
| Previous Owner | Chow Fung | $38,500 | |
| Previous Owner | Chow Fung | $427,000 | |
| Previous Owner | Zhan Sui Jiao | $180,000 |
Source: Public Records
Tax History
| Year | Tax Paid | Tax Assessment Tax Assessment Total Assessment is a certain percentage of the fair market value that is determined by local assessors to be the total taxable value of land and additions on the property. | Land | Improvement |
|---|---|---|---|---|
| 2025 | $11,713 | $62,705 | $11,421 | $51,284 |
| 2024 | $11,725 | $59,719 | $10,215 | $49,504 |
| 2023 | $11,713 | $59,719 | $8,674 | $51,045 |
| 2022 | $11,433 | $83,700 | $12,480 | $71,220 |
| 2021 | $11,360 | $82,140 | $12,480 | $69,660 |
| 2020 | $10,765 | $75,720 | $12,480 | $63,240 |
| 2019 | $10,118 | $79,560 | $12,480 | $67,080 |
| 2018 | $9,847 | $49,766 | $9,209 | $40,557 |
| 2017 | $9,674 | $48,925 | $10,678 | $38,247 |
| 2016 | $8,917 | $48,925 | $10,678 | $38,247 |
| 2015 | $5,347 | $43,545 | $11,579 | $31,966 |
| 2014 | $5,347 | $41,472 | $11,330 | $30,142 |
Source: Public Records
Map
Nearby Homes
- 51-02 Junction Blvd
- 94-29 51st Ave
- 94-14 Corona Ave
- 96-15 Alstyne Ave
- 94-28 53rd Ave
- 9235 51st Ave
- 97-40 Corona Ave
- 93-10 50th Ave
- 98-08 Alstyne Ave
- 4722 98th St
- 94-66 45th Ave
- 94-68 45th Ave
- 94-44 45th Ave
- 98-22 Alstyne Ave
- 97-69 Corona Ave
- 43-20 Junction Blvd
- 43-16 Junction Blvd
- 9844 Corona Ave
- 94-27 43rd Ave
- 47-19 99th St
- 5005 Junction Blvd
- 5001 Junction Blvd
- 5007 Junction Blvd
- 5009 Junction Blvd
- 5004 96th St
- 5002 96th St
- 5011 Junction Blvd
- 5006 96th St
- 5008 96th St
- 50-18 96th St
- 5013 Junction Blvd
- 50-13 Junction Blvd
- 5016 96th St
- 9505 50th Ave
- 96-04 50th Ave
- 5024 Junction Blvd
- 9507 50th Ave
- 5018 96th St
- 96-08 50th Ave
- 50-24 Junction Blvd
Your Personal Tour Guide
Ask me questions while you tour the home.