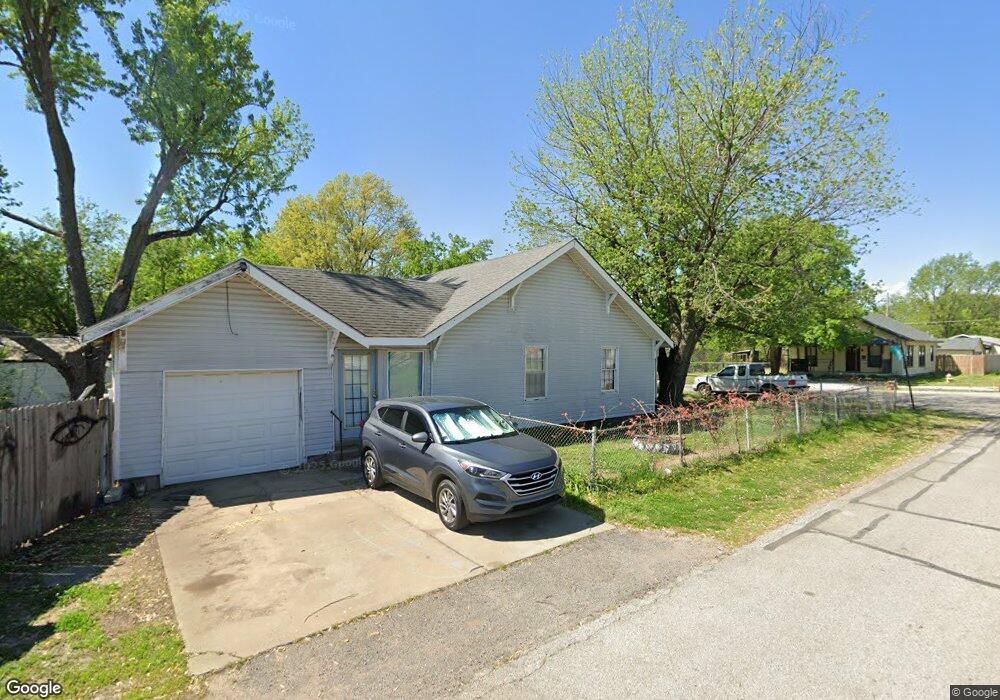
5003 S 30th West Ave Tulsa, OK 74107
Red Fork NeighborhoodEstimated Value: $104,976 - $143,000
2
Beds
1
Bath
1,072
Sq Ft
$118/Sq Ft
Est. Value
About This Home
This home is located at 5003 S 30th West Ave, Tulsa, OK 74107 and is currently estimated at $125,994, approximately $117 per square foot. 5003 S 30th West Ave is a home located in Tulsa County with nearby schools including Robertson Elementary School, Daniel Webster High School, and St Catherine School.
Ownership History
Date
Name
Owned For
Owner Type
Purchase Details
Closed on
Nov 21, 2023
Sold by
Harger Haden Earnest
Bought by
Wilkins Lesa Beth and Arellanes Andrea
Current Estimated Value
Purchase Details
Closed on
Dec 28, 2022
Sold by
Wilkins Lesa Beth
Bought by
Wilkins Lesa Beth and Arellanes Andrea
Purchase Details
Closed on
May 7, 2020
Sold by
Harger Eunice
Bought by
Harger Eunice and Wilkins Lesa
Purchase Details
Closed on
Jun 30, 1998
Sold by
Spiritbank Na
Bought by
Harger Haden and Harger Eunice
Purchase Details
Closed on
Nov 4, 1997
Sold by
Glanz Stanley and Glanz James William
Bought by
Spiritbank N A
Purchase Details
Closed on
Feb 1, 1996
Purchase Details
Closed on
Oct 1, 1987
Create a Home Valuation Report for This Property
The Home Valuation Report is an in-depth analysis detailing your home's value as well as a comparison with similar homes in the area
Home Values in the Area
Average Home Value in this Area
Purchase History
| Date | Buyer | Sale Price | Title Company |
|---|---|---|---|
| Wilkins Lesa Beth | -- | None Listed On Document | |
| Wilkins Lesa Beth | -- | -- | |
| Harger Eunice | -- | None Available | |
| Harger Haden | $30,000 | Delta Title & Escrow Company | |
| Spiritbank N A | $49,152 | -- | |
| -- | $36,000 | -- | |
| -- | $38,000 | -- |
Source: Public Records
Tax History Compared to Growth
Tax History
| Year | Tax Paid | Tax Assessment Tax Assessment Total Assessment is a certain percentage of the fair market value that is determined by local assessors to be the total taxable value of land and additions on the property. | Land | Improvement |
|---|---|---|---|---|
| 2025 | $929 | $6,936 | $1,206 | $5,730 |
| 2024 | $798 | $6,605 | $1,697 | $4,908 |
| 2023 | $798 | $6,291 | $1,617 | $4,674 |
| 2022 | $799 | $5,991 | $1,847 | $4,144 |
| 2021 | $754 | $5,706 | $1,759 | $3,947 |
| 2020 | $708 | $5,435 | $1,676 | $3,759 |
| 2019 | $745 | $5,435 | $1,676 | $3,759 |
| 2018 | $741 | $5,394 | $1,663 | $3,731 |
| 2017 | $704 | $5,137 | $1,584 | $3,553 |
| 2016 | $690 | $5,137 | $1,584 | $3,553 |
| 2015 | $691 | $5,137 | $1,584 | $3,553 |
| 2014 | $684 | $5,137 | $1,584 | $3,553 |
Source: Public Records
Map
Nearby Homes
- 5035 S 31st West Ave
- 4823 S 27th Ave W
- 5023 S 27th West Ave
- 4727 S 33rd West Ave
- 4718 S 25th West Ave
- 4532 S 28th West Ave
- 2317 W 47th Place
- 2312 W 47th Place
- 5032 S 36th West Ave
- 4844 S 34th Ave W
- 4529 E 24th West Ave
- 2114 W 48th St
- 2022 W 43rd St
- 4245 S 28th West Ave
- 5353 S 33rd West Ave
- 2114 W 45th Place
- 1905 W 49th St
- 1908 W 47th Place
- 4532 S Xenophon Ave
- 3743 W 45th St
- 5007 S 30th West Ave
- 5009 S 30th West Ave
- 4849 S 30th West Ave
- 5002 S 29th West Ave
- 5011 S 30th West Ave
- 5006 S 29th West Ave
- 4843 S 30th West Ave
- 5010 S 29th West Ave
- 4848 S 29th West Ave
- 5015 S 30th West Ave
- 5016 S 29th West Ave
- 5002 S 30th West Ave
- 4839 S 30th Ave W
- 4839 S 30th West Ave
- 5008 S 30th West Ave
- 4848 S 30th West Ave
- 4840 S 29th West Ave
- 5018 S 29th West Ave
- 5021 S 30th West Ave