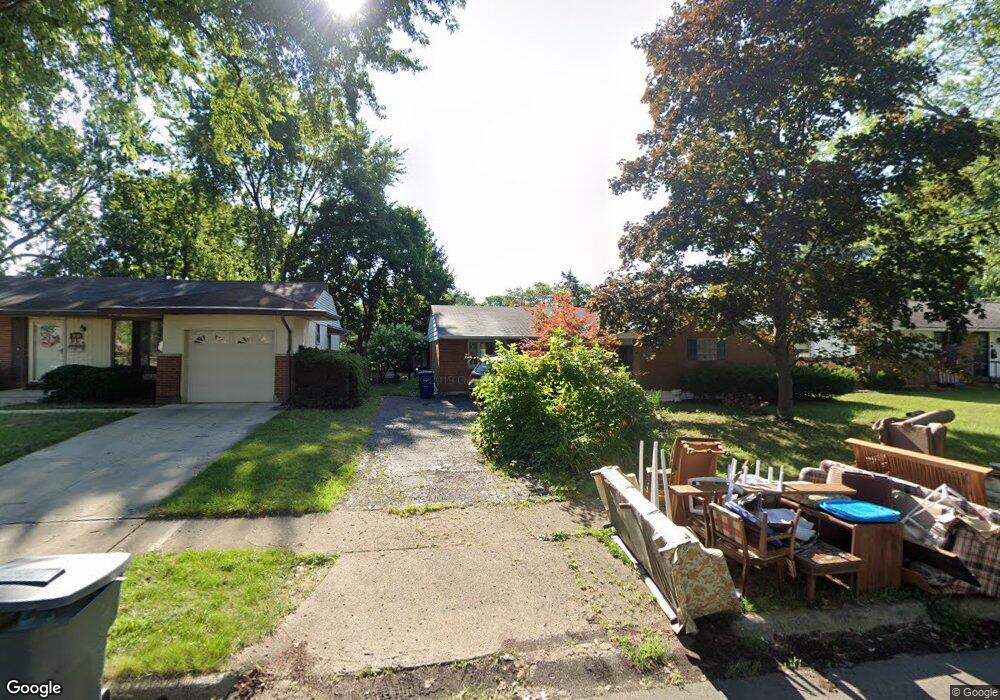
5004 Julie Place Columbus, OH 43229
Woodward Park NeighborhoodEstimated Value: $252,710 - $284,000
3
Beds
1
Bath
1,467
Sq Ft
$180/Sq Ft
Est. Value
About This Home
This home is located at 5004 Julie Place, Columbus, OH 43229 and is currently estimated at $264,428, approximately $180 per square foot. 5004 Julie Place is a home located in Franklin County with nearby schools including Valley Forge Elementary School, Woodward Park Middle School, and Northland High School.
Ownership History
Date
Name
Owned For
Owner Type
Purchase Details
Closed on
May 31, 2019
Sold by
Baer Ronald S and Wells Fargo Bank Na
Bought by
Azad Mike and Azad Fariba
Current Estimated Value
Purchase Details
Closed on
Apr 3, 2009
Sold by
Schluep Karen D and Baer Karen D
Bought by
Baer Ronald S
Purchase Details
Closed on
Mar 14, 2003
Sold by
Guden John E
Bought by
Baer Ronald S
Home Financials for this Owner
Home Financials are based on the most recent Mortgage that was taken out on this home.
Original Mortgage
$109,000
Interest Rate
5.95%
Mortgage Type
VA
Purchase Details
Closed on
Jul 3, 1996
Sold by
Zeek John W
Bought by
John E Guden
Home Financials for this Owner
Home Financials are based on the most recent Mortgage that was taken out on this home.
Original Mortgage
$50,000
Interest Rate
8.75%
Mortgage Type
New Conventional
Purchase Details
Closed on
Jul 31, 1992
Purchase Details
Closed on
Nov 25, 1987
Create a Home Valuation Report for This Property
The Home Valuation Report is an in-depth analysis detailing your home's value as well as a comparison with similar homes in the area
Home Values in the Area
Average Home Value in this Area
Purchase History
| Date | Buyer | Sale Price | Title Company |
|---|---|---|---|
| Azad Mike | $115,800 | None Available | |
| Baer Ronald S | -- | Attorney | |
| Baer Ronald S | $106,900 | -- | |
| John E Guden | $84,000 | -- | |
| -- | $76,000 | -- | |
| -- | $62,000 | -- |
Source: Public Records
Mortgage History
| Date | Status | Borrower | Loan Amount |
|---|---|---|---|
| Previous Owner | Baer Ronald S | $109,000 | |
| Previous Owner | John E Guden | $50,000 |
Source: Public Records
Tax History Compared to Growth
Tax History
| Year | Tax Paid | Tax Assessment Tax Assessment Total Assessment is a certain percentage of the fair market value that is determined by local assessors to be the total taxable value of land and additions on the property. | Land | Improvement |
|---|---|---|---|---|
| 2024 | $3,506 | $76,510 | $19,950 | $56,560 |
| 2023 | $3,463 | $76,510 | $19,950 | $56,560 |
| 2022 | $2,357 | $44,350 | $10,500 | $33,850 |
| 2021 | $2,361 | $44,350 | $10,500 | $33,850 |
| 2020 | $3,143 | $44,350 | $10,500 | $33,850 |
| 2019 | $2,276 | $36,260 | $8,400 | $27,860 |
| 2018 | $2,040 | $36,260 | $8,400 | $27,860 |
| 2017 | $2,157 | $36,260 | $8,400 | $27,860 |
| 2016 | $2,075 | $31,330 | $7,810 | $23,520 |
| 2015 | $1,884 | $31,330 | $7,810 | $23,520 |
| 2014 | $1,889 | $31,330 | $7,810 | $23,520 |
| 2013 | $981 | $32,970 | $8,225 | $24,745 |
Source: Public Records
Map
Nearby Homes
- 1485 Norma Rd
- 4923 Karl Rd Unit 4925
- 5022 Sienna Ln
- 1385 Thurell Rd
- 4852 Colonel Perry Dr
- 1414 Alvina Dr
- 4816 Bourke Rd
- 4815 Bourke Rd
- 4800 Bourke Rd
- 1493 Boxwood Dr
- 1704 Riverbirch Dr
- 4791 Bourke Rd
- 4761 Colonel Perry Dr
- 5231 Arrowood Ct
- 5290 Hazelwood Rd
- 4904 Almont Dr
- 4840 Almont Dr
- 4983 Almont Dr
- 1125 Upland Dr
- 1116 Tulsa Dr
- 5010 Julie Place
- 4996 Julie Place
- 4993 Karl Rd
- 5016 Julie Place
- 5001 Karl Rd
- 4985 Karl Rd
- 4984 Julie Place
- 1532 Norma Rd
- 5009 Karl Rd
- 5005 Julie Place
- 4999 Julie Place
- 1540 Norma Rd
- 1503 Thurell Rd
- 4989 Julie Place
- 5017 Karl Rd
- 5024 Julie Place
- 1502 Norma Rd
- 5025 Karl Rd
- 1520 Thurell Rd
- 1495 Thurell Rd