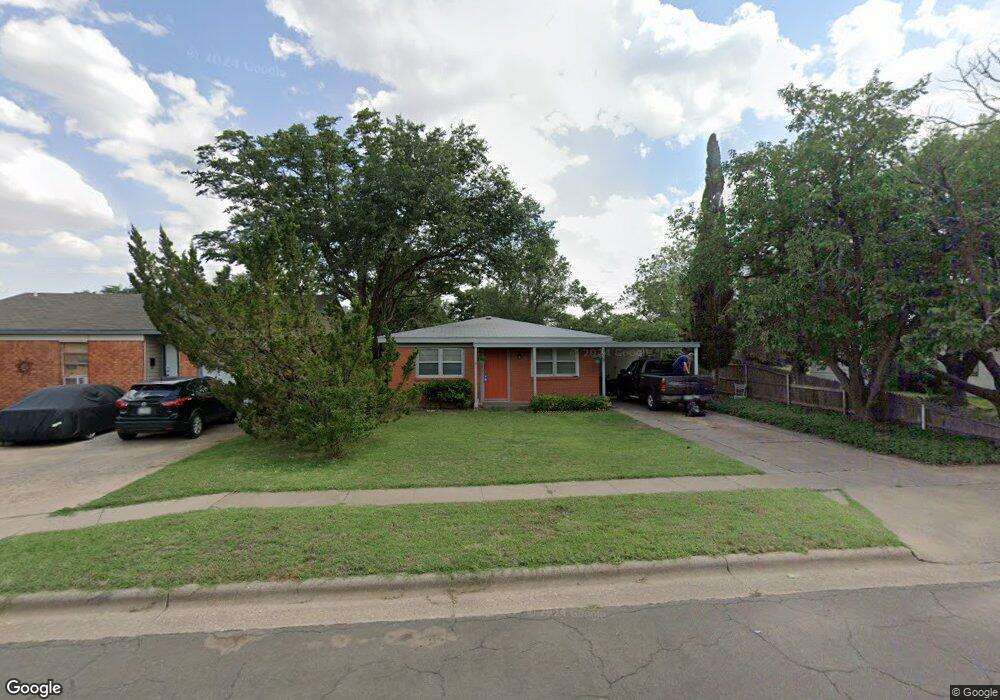
5005 37th St Lubbock, TX 79414
Stubbs-Stewart NeighborhoodEstimated Value: $99,000 - $105,000
2
Beds
1
Bath
884
Sq Ft
$116/Sq Ft
Est. Value
About This Home
This home is located at 5005 37th St, Lubbock, TX 79414 and is currently estimated at $102,774, approximately $116 per square foot. 5005 37th St is a home located in Lubbock County with nearby schools including Stewart Elementary School, Irons Middle School, and Coronado High School.
Ownership History
Date
Name
Owned For
Owner Type
Purchase Details
Closed on
Aug 18, 2016
Sold by
Maxian Wendy A
Bought by
Smmp Llc
Current Estimated Value
Home Financials for this Owner
Home Financials are based on the most recent Mortgage that was taken out on this home.
Original Mortgage
$56,000
Outstanding Balance
$44,580
Interest Rate
3.41%
Estimated Equity
$58,194
Purchase Details
Closed on
Jan 29, 1996
Sold by
Lawson Jack A
Bought by
Crittenden Phillis Gail
Create a Home Valuation Report for This Property
The Home Valuation Report is an in-depth analysis detailing your home's value as well as a comparison with similar homes in the area
Home Values in the Area
Average Home Value in this Area
Purchase History
| Date | Buyer | Sale Price | Title Company |
|---|---|---|---|
| Smmp Llc | -- | None Available | |
| Crittenden Phillis Gail | -- | -- |
Source: Public Records
Mortgage History
| Date | Status | Borrower | Loan Amount |
|---|---|---|---|
| Open | Smmp Llc | $56,000 |
Source: Public Records
Tax History
| Year | Tax Paid | Tax Assessment Tax Assessment Total Assessment is a certain percentage of the fair market value that is determined by local assessors to be the total taxable value of land and additions on the property. | Land | Improvement |
|---|---|---|---|---|
| 2025 | $400 | $93,641 | $23,000 | $70,641 |
| 2024 | $15 | $100,338 | $9,000 | $91,338 |
| 2023 | $1,408 | $75,728 | $9,000 | $66,728 |
| 2022 | $1,394 | $68,844 | $9,000 | $90,439 |
| 2021 | $1,340 | $62,585 | $9,000 | $53,585 |
| 2020 | $1,361 | $62,585 | $9,000 | $53,585 |
| 2019 | $1,405 | $62,585 | $9,000 | $53,585 |
| 2018 | $1,325 | $58,945 | $9,000 | $49,945 |
| 2017 | $1,206 | $53,586 | $9,000 | $44,586 |
| 2016 | $1,106 | $49,156 | $7,100 | $42,056 |
| 2015 | $895 | $44,687 | $7,100 | $37,587 |
| 2014 | $895 | $48,603 | $3,250 | $45,353 |
Source: Public Records
Map
Nearby Homes