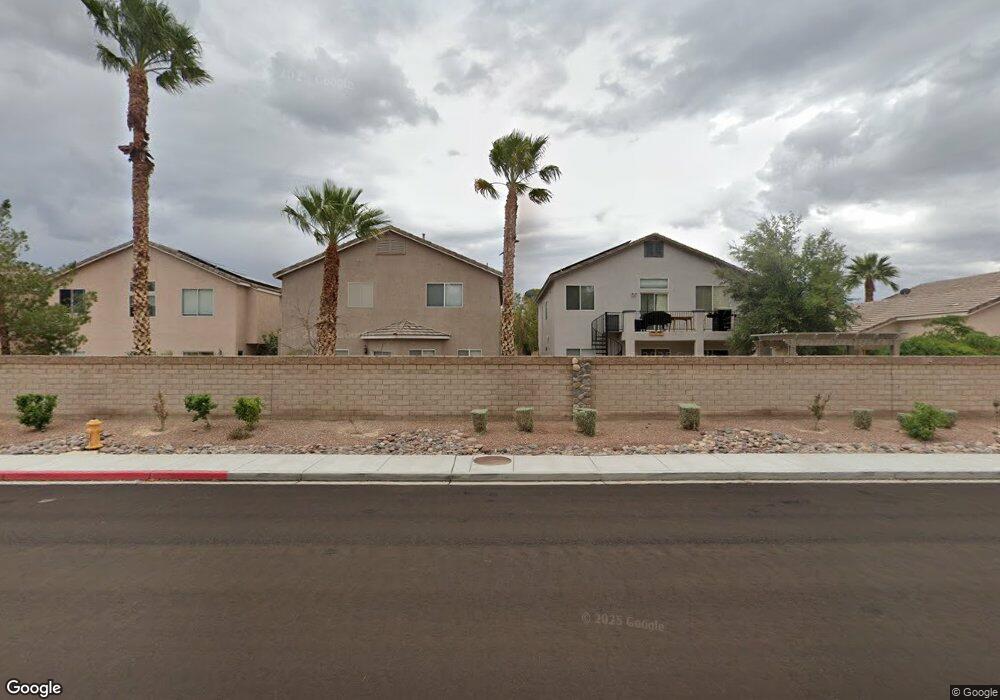
5005 Cascade Pools Ave Unit 9B Las Vegas, NV 89131
Tule Springs NeighborhoodEstimated Value: $431,000 - $480,000
4
Beds
3
Baths
1,928
Sq Ft
$240/Sq Ft
Est. Value
About This Home
This home is located at 5005 Cascade Pools Ave Unit 9B, Las Vegas, NV 89131 and is currently estimated at $462,384, approximately $239 per square foot. 5005 Cascade Pools Ave Unit 9B is a home located in Clark County with nearby schools including Howard E Heckethorn Elementary School, Anthony Saville Middle School, and Shadow Ridge High School.
Ownership History
Date
Name
Owned For
Owner Type
Purchase Details
Closed on
Jul 1, 2023
Sold by
Redford Family Trust and Redford Steven G
Bought by
Redford
Current Estimated Value
Purchase Details
Closed on
Jun 28, 2007
Sold by
Redford Steven Glenn and Redford Ivette
Bought by
Redford Steven Glenn and Redford Ivette
Purchase Details
Closed on
Mar 8, 2001
Sold by
Beazer Homes Holdings Corp
Bought by
Redford Steven Glenn and Redford Ivette
Home Financials for this Owner
Home Financials are based on the most recent Mortgage that was taken out on this home.
Original Mortgage
$169,274
Interest Rate
7.09%
Mortgage Type
VA
Create a Home Valuation Report for This Property
The Home Valuation Report is an in-depth analysis detailing your home's value as well as a comparison with similar homes in the area
Home Values in the Area
Average Home Value in this Area
Purchase History
| Date | Buyer | Sale Price | Title Company |
|---|---|---|---|
| Redford | -- | None Listed On Document | |
| Redford Steven Glenn | -- | None Available | |
| Redford Steven Glenn | $164,344 | First American Title Co |
Source: Public Records
Mortgage History
| Date | Status | Borrower | Loan Amount |
|---|---|---|---|
| Previous Owner | Redford Steven Glenn | $169,274 |
Source: Public Records
Tax History Compared to Growth
Tax History
| Year | Tax Paid | Tax Assessment Tax Assessment Total Assessment is a certain percentage of the fair market value that is determined by local assessors to be the total taxable value of land and additions on the property. | Land | Improvement |
|---|---|---|---|---|
| 2025 | $2,188 | $119,327 | $29,400 | $89,927 |
| 2024 | $1,932 | $119,327 | $29,400 | $89,927 |
| 2023 | $1,932 | $116,774 | $32,200 | $84,574 |
| 2022 | $1,876 | $104,632 | $26,950 | $77,682 |
| 2021 | $1,822 | $97,589 | $23,800 | $73,789 |
| 2020 | $1,766 | $95,613 | $22,400 | $73,213 |
| 2019 | $1,714 | $92,260 | $20,300 | $71,960 |
| 2018 | $1,664 | $85,256 | $16,100 | $69,156 |
| 2017 | $2,773 | $84,576 | $14,350 | $70,226 |
| 2016 | $1,491 | $72,692 | $10,413 | $62,279 |
| 2015 | $1,573 | $60,059 | $8,033 | $52,026 |
| 2014 | $1,502 | $50,272 | $8,925 | $41,347 |
Source: Public Records
Map
Nearby Homes
- 5004 Cascade Pools Ave
- 5001 Morning Falls Ave
- 4905 Morning Falls Ave
- 5047 Naff Ridge Dr
- 5009 Royal Lake Ave
- 4832 Whispering Spring Ave
- 7628 Catalina Harbor St
- 7342 N Decatur Blvd Unit 5
- 7633 Rainbow Cove Dr
- 7620 Catalina Harbor St
- 7825 Celestial Sky St Unit 2
- 7825 Celestial Sky St Unit 812
- 5033 Wild Buffalo Ave
- 7830 Celestial Sky St Unit 762
- 7830 Celestial Sky St Unit 763
- 1349 Plan at Juno Pointe
- 1171 Plan at Juno Pointe
- 1600 Plan at Juno Pointe
- 4821 Whisper Lake Ave
- 5001 Pounding Surf Ave
- 5001 Cascade Pools Ave
- 5009 Cascade Pools Ave
- 4933 Cascade Pools Ave
- 5013 Cascade Pools Ave
- 5004 Morning Falls Ave
- 5008 Morning Falls Ave Unit 9B
- 5000 Morning Falls Ave
- 4929 Cascade Pools Ave Unit 9C
- 5017 Cascade Pools Ave
- 5012 Morning Falls Ave Unit 9B
- 4932 Morning Falls Ave
- 5008 Cascade Pools Ave Unit 9B
- 5000 Cascade Pools Ave
- 5012 Cascade Pools Ave
- 5016 Morning Falls Ave
- 5016 Morning Falls Ave Unit na
- 4928 Morning Falls Ave
- 4932 Cascade Pools Ave
- 4925 Cascade Pools Ave
- 5021 Cascade Pools Ave