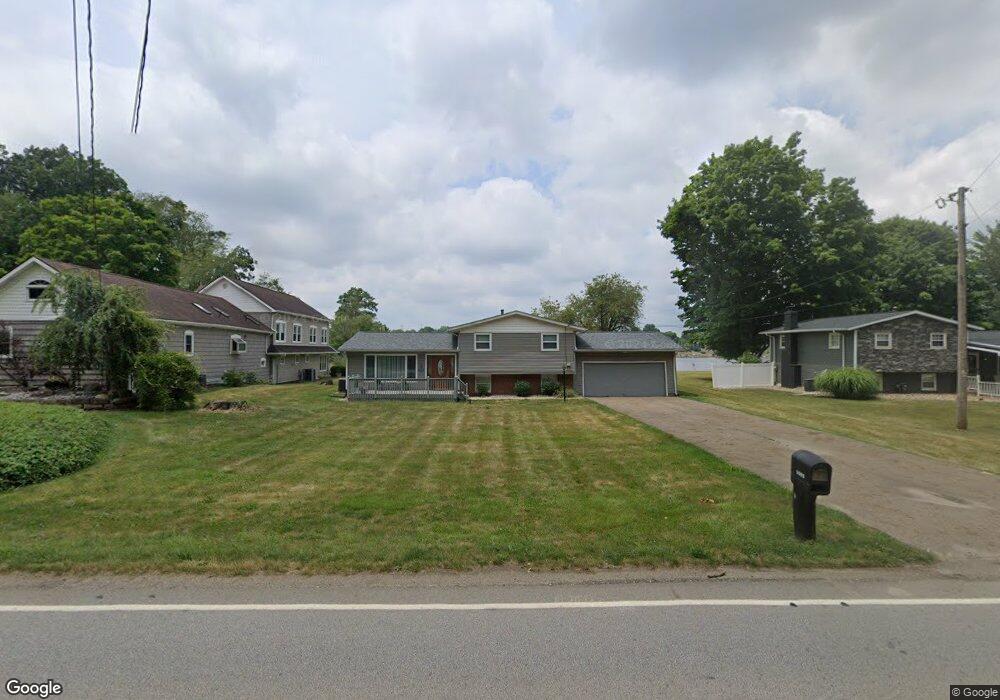
5005 Harmont Ave NE Canton, OH 44705
Plain Township NeighborhoodEstimated Value: $143,000 - $295,000
3
Beds
1
Bath
1,573
Sq Ft
$142/Sq Ft
Est. Value
About This Home
This home is located at 5005 Harmont Ave NE, Canton, OH 44705 and is currently estimated at $223,244, approximately $141 per square foot. 5005 Harmont Ave NE is a home located in Stark County with nearby schools including Ransom H. Barr Elementary School, Glenwood Intermediate School, and GlenOak High School.
Ownership History
Date
Name
Owned For
Owner Type
Purchase Details
Closed on
Dec 18, 2024
Sold by
Vanthia Olmstead Irrevocable Trust and Gattuso Anthony C
Bought by
Vanthia Olmstead Irrevocable Trust and Gattuso
Current Estimated Value
Purchase Details
Closed on
Apr 1, 2024
Sold by
Proios Vanthia and Olmstead Vanthia P
Bought by
Vanthia Olmstead Irrevocable Trust and Gattuso
Purchase Details
Closed on
Jun 27, 2016
Bought by
Wilbur Olmstead and Vanthia Olmstead
Home Financials for this Owner
Home Financials are based on the most recent Mortgage that was taken out on this home.
Interest Rate
3.56%
Create a Home Valuation Report for This Property
The Home Valuation Report is an in-depth analysis detailing your home's value as well as a comparison with similar homes in the area
Home Values in the Area
Average Home Value in this Area
Purchase History
| Date | Buyer | Sale Price | Title Company |
|---|---|---|---|
| Vanthia Olmstead Irrevocable Trust | -- | None Listed On Document | |
| Vanthia Olmstead Irrevocable Trust | -- | None Listed On Document | |
| Vanthia Olmstead Irrevocable Trust | -- | None Listed On Document | |
| Vanthia Olmstead Irrevocable Trust | -- | None Listed On Document | |
| Wilbur Olmstead | $146,000 | -- |
Source: Public Records
Mortgage History
| Date | Status | Borrower | Loan Amount |
|---|---|---|---|
| Previous Owner | Wilbur Olmstead | -- |
Source: Public Records
Tax History Compared to Growth
Tax History
| Year | Tax Paid | Tax Assessment Tax Assessment Total Assessment is a certain percentage of the fair market value that is determined by local assessors to be the total taxable value of land and additions on the property. | Land | Improvement |
|---|---|---|---|---|
| 2025 | -- | -- | -- | -- |
| 2024 | -- | $83,580 | $42,000 | $41,580 |
| 2023 | $2,883 | $60,520 | $13,510 | $47,010 |
| 2022 | $2,897 | $60,520 | $13,510 | $47,010 |
| 2021 | $2,910 | $60,520 | $13,510 | $47,010 |
| 2020 | $2,168 | $40,960 | $11,660 | $29,300 |
| 2019 | $2,146 | $40,890 | $11,660 | $29,230 |
| 2018 | $2,124 | $40,890 | $11,660 | $29,230 |
| 2017 | $2,093 | $37,000 | $10,820 | $26,180 |
| 2016 | $2,045 | $37,000 | $10,820 | $26,180 |
| 2015 | $2,233 | $41,800 | $10,820 | $30,980 |
| 2014 | $1,840 | $33,680 | $8,720 | $24,960 |
| 2013 | $1,797 | $33,680 | $8,720 | $24,960 |
Source: Public Records
Map
Nearby Homes
- 3030 55th St NE
- 5700 Birmingham Rd NE
- 2419 Bur Oak St NE
- 4701 Roosevelt Ave NE
- 2317 Raintree St NE
- 4123 Regentview St NE
- 2216 49th St NE
- 2323 Fencegate St NE
- 2211 48th St NE
- 3951 Glenoak Dr NE
- 2511 58th St NE
- 3730 Kirby Ave NE
- 2550 Chaucer Dr NE
- 5109 Columbus Rd NE
- 5208 Oakridge Dr
- 1852 Southpointe Cir NE Unit 39W
- 1709 Southpointe Cir NE Unit 25W
- 6110 Glessner Ave NE
- 3305 Regent Ave NE
- 1912 40th St NE
- 4929 Harmont Ave NE
- 5015 Harmont Ave NE
- 4921 Harmont Ave NE
- 5025 Harmont Ave NE
- 5033 Harmont Ave NE
- 4908 Harmont Ave NE
- 4911 Harmont Ave NE
- 4911 Harmont Ave NE
- 5045 Harmont Ave NE
- 4821 Harmont Ave NE
- 5103 Harmont Ave NE
- 4814 Harmont Ave NE
- 4809 Harmont Ave NE
- 5115 Harmont Ave NE
- 3061 Wolverine St NE
- 4760 Harmont Ave NE
- 5121 Harmont Ave NE
- 4757 Harmont Ave NE
- 5135 Harmont Ave NE
- 3099 Wolverine St NE