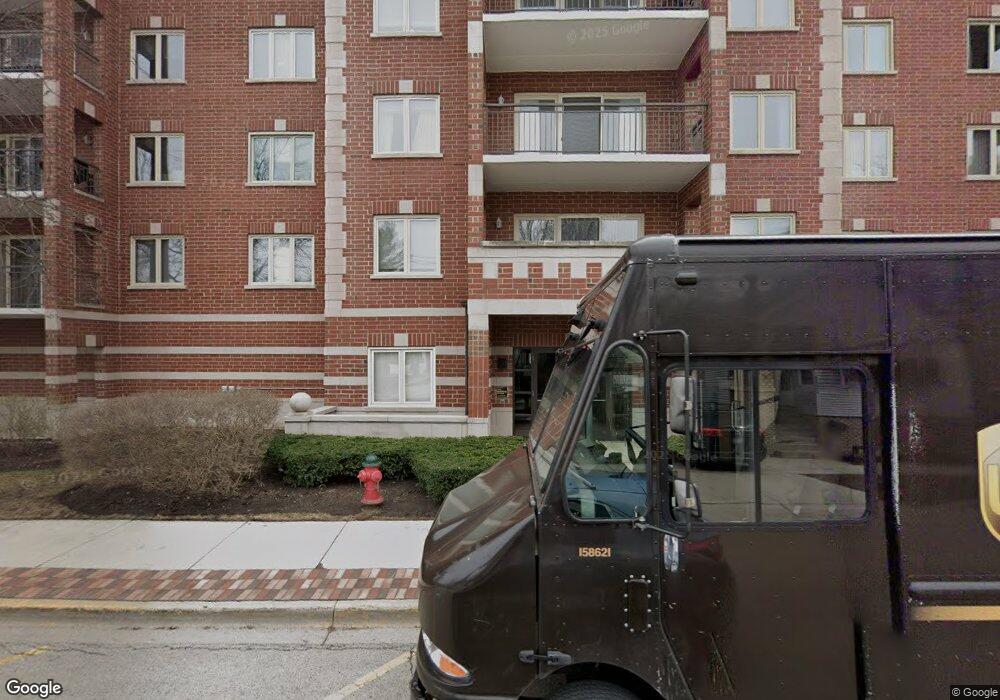
5005 Warren St Unit 2506 Skokie, IL 60077
Southwest Skokie NeighborhoodEstimated Value: $214,000 - $261,000
1
Bed
--
Bath
173,038
Sq Ft
$1/Sq Ft
Est. Value
About This Home
This home is located at 5005 Warren St Unit 2506, Skokie, IL 60077 and is currently estimated at $244,312, approximately $1 per square foot. 5005 Warren St Unit 2506 is a home located in Cook County with nearby schools including Madison Elementary School, Thomas Edison Elementary School, and Lincoln Junior High School.
Ownership History
Date
Name
Owned For
Owner Type
Purchase Details
Closed on
Feb 21, 2014
Sold by
Federal Home Loan Mortgage Corporation
Bought by
Klein Lance P and Klein Judith F
Current Estimated Value
Home Financials for this Owner
Home Financials are based on the most recent Mortgage that was taken out on this home.
Original Mortgage
$74,025
Outstanding Balance
$56,808
Interest Rate
4.75%
Mortgage Type
New Conventional
Estimated Equity
$187,504
Purchase Details
Closed on
Oct 21, 2013
Sold by
Brush Ann
Bought by
Federal Home Loan Mortgage Corporation
Purchase Details
Closed on
Sep 8, 2005
Sold by
Miller Patricia and Kathleen J Carey Revocable Tru
Bought by
Brush Ann
Home Financials for this Owner
Home Financials are based on the most recent Mortgage that was taken out on this home.
Original Mortgage
$163,200
Interest Rate
6.01%
Mortgage Type
Fannie Mae Freddie Mac
Create a Home Valuation Report for This Property
The Home Valuation Report is an in-depth analysis detailing your home's value as well as a comparison with similar homes in the area
Home Values in the Area
Average Home Value in this Area
Purchase History
| Date | Buyer | Sale Price | Title Company |
|---|---|---|---|
| Klein Lance P | $99,000 | Attorneys Title Guaranty Fun | |
| Klein Lance P | $99,000 | Attorneys Title Guaranty Fund | |
| Federal Home Loan Mortgage Corporation | -- | None Available | |
| Brush Ann | $204,000 | -- |
Source: Public Records
Mortgage History
| Date | Status | Borrower | Loan Amount |
|---|---|---|---|
| Open | Klein Lance P | $74,025 | |
| Closed | Klein Lance P | $74,025 | |
| Previous Owner | Brush Ann | $163,200 |
Source: Public Records
Tax History Compared to Growth
Tax History
| Year | Tax Paid | Tax Assessment Tax Assessment Total Assessment is a certain percentage of the fair market value that is determined by local assessors to be the total taxable value of land and additions on the property. | Land | Improvement |
|---|---|---|---|---|
| 2024 | $3,824 | $18,230 | $725 | $17,505 |
| 2023 | $1,261 | $18,230 | $725 | $17,505 |
| 2022 | $1,261 | $18,230 | $725 | $17,505 |
| 2021 | $1,426 | $13,291 | $446 | $12,845 |
| 2020 | $2,771 | $13,291 | $446 | $12,845 |
| 2019 | $3,004 | $15,519 | $446 | $15,073 |
| 2018 | $4,358 | $12,173 | $404 | $11,769 |
| 2017 | $1,552 | $12,173 | $404 | $11,769 |
| 2016 | $2,271 | $12,173 | $404 | $11,769 |
| 2015 | $3,991 | $11,177 | $348 | $10,829 |
| 2014 | $3,901 | $11,177 | $348 | $10,829 |
| 2013 | $3,954 | $11,177 | $348 | $10,829 |
Source: Public Records
Map
Nearby Homes
- 5000 Oakton St Unit 505
- 4953 Oakton St Unit 207
- 4953 Oakton St Unit 510
- 4953 Oakton St Unit P11
- 8210 Elmwood Ave Unit 110
- 4906 Hull St
- 4856 Hull St
- 7848 Lincoln Ave
- 4907 Hull St
- 8230 Elmwood St Unit 405
- 8232 Niles Center Rd Unit 304
- 8232 Niles Center Rd Unit 202
- 8232 Niles Center Rd Unit 317
- 5148 Cleveland St
- 5207 Galitz St
- 7748 Lincoln Ave
- 5001 Madison St Unit 3A
- 8140 Keating Ave
- 5251 Galitz St Unit 410
- 5251 Galitz St Unit 311
- 5005 Warren St Unit 409
- 5005 Warren St Unit 2404
- 5005 Warren St Unit 2502
- 5005 Warren St Unit 2607
- 5005 Warren St Unit 2509
- 5005 Warren St Unit 2503
- 5005 Warren St Unit 2501
- 5005 Warren St Unit 2304
- 5005 Warren St Unit 2406
- 5005 Warren St Unit 2602
- 5005 Warren St Unit 2302
- 5005 Warren St Unit 2203
- 5005 Warren St Unit 2307
- 5005 Warren St Unit 2206
- 5005 Warren St Unit 2305
- 5005 Warren St Unit 2409
- 5005 Warren St Unit 2405
- 5005 Warren St Unit 2201
- 5005 Warren St Unit 2505
- 5005 Warren St Unit 2207