Estimated Value: $87,739 - $165,000
--
Bed
1
Bath
1,632
Sq Ft
$85/Sq Ft
Est. Value
About This Home
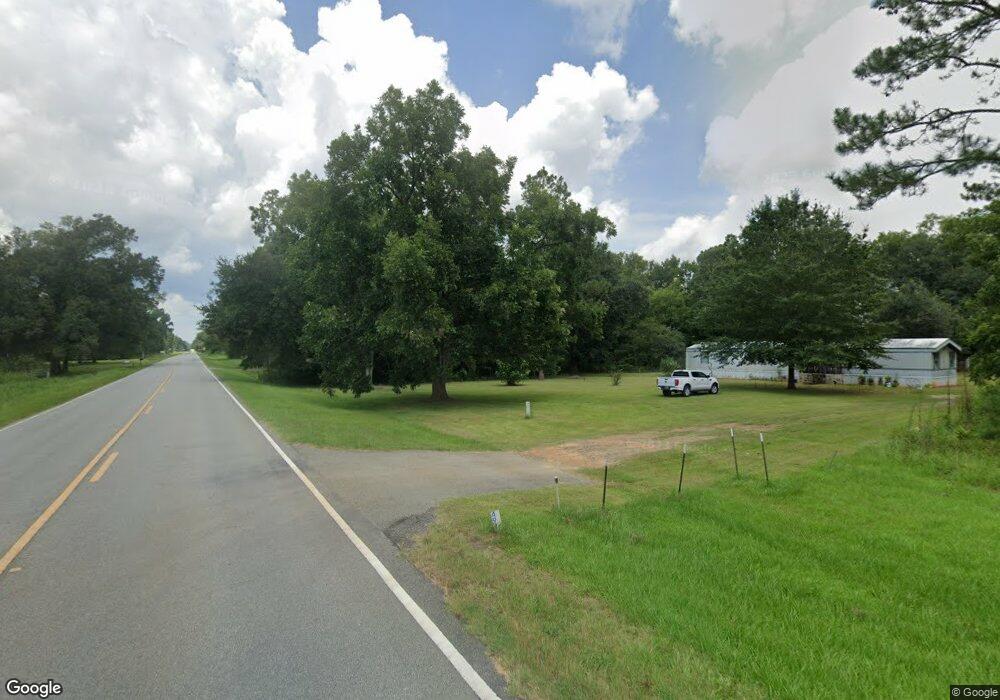
This home is located at 5006 N Depot St, Leary, GA 39862 and is currently estimated at $138,580, approximately $84 per square foot. 5006 N Depot St is a home located in Calhoun County with nearby schools including Calhoun County Elementary School, Calhoun County Middle School, and Calhoun County High School.
Ownership History
Date
Name
Owned For
Owner Type
Purchase Details
Closed on
Mar 18, 1991
Bought by
Milner Hershell G
Current Estimated Value
Create a Home Valuation Report for This Property
The Home Valuation Report is an in-depth analysis detailing your home's value as well as a comparison with similar homes in the area
Home Values in the Area
Average Home Value in this Area
Purchase History
| Date | Buyer | Sale Price | Title Company |
|---|---|---|---|
| Milner Hershell G | -- | -- |
Source: Public Records
Tax History Compared to Growth
Tax History
| Year | Tax Paid | Tax Assessment Tax Assessment Total Assessment is a certain percentage of the fair market value that is determined by local assessors to be the total taxable value of land and additions on the property. | Land | Improvement |
|---|---|---|---|---|
| 2025 | $1,189 | $30,659 | $2,935 | $27,724 |
| 2024 | $1,190 | $30,659 | $2,935 | $27,724 |
| 2023 | $184 | $30,659 | $2,935 | $27,724 |
| 2022 | $795 | $30,459 | $2,935 | $27,524 |
| 2021 | $780 | $28,887 | $2,935 | $25,952 |
| 2020 | $1,455 | $28,887 | $2,935 | $25,952 |
| 2019 | $847 | $29,258 | $2,935 | $26,323 |
| 2018 | $783 | $29,258 | $2,935 | $26,323 |
| 2017 | $1,254 | $29,258 | $2,935 | $26,323 |
| 2016 | $701 | $28,620 | $2,935 | $25,685 |
| 2015 | -- | $28,220 | $2,935 | $25,285 |
| 2014 | -- | $29,066 | $2,935 | $26,131 |
| 2013 | -- | $29,066 | $2,934 | $26,131 |
Source: Public Records
Map
Nearby Homes
- 5227 Georgia 37
- 77 Melvin St
- 96 Martin Luther King jr Dr
- 0 Hart Ln
- 0 Georgia 41
- William Avera Rd
- 0 Buck Rd Unit 10658812
- 31 Georgia 41
- Cordrays Mill S
- 9050 Elmodel Hwy
- 33895 Ga-45
- 0 William Avera Rd
- 00 Hwy 41
- 0 Nantze Springs Rd
- Crestview Rd
- 2250 Milford Rd
- 221 ac Crestview Rd
- 2700 Silo Rd
- 69 Greenleaf Ave NE
- 10 Re Jennings Ave SE
- 4972 N Depot St
- 5047 N Depot St
- 5064 N Depot St
- 4872 N Depot St
- 4865 N Depot St
- 4836 N Depot St
- 4835 N Depot St
- 948 Hotel St
- 4799 N Depot St
- 5227 Ga Highway 37
- 74 Barnes Ln
- 4780 N Depot St
- 520 Hotel St
- 4763 N Depot St
- 4744 N Depot St
- 4743 N Depot St
- 4725 N Depot St
- 4718 N Depot St
- 58 Barnes Ln
- 4690 N Depot St