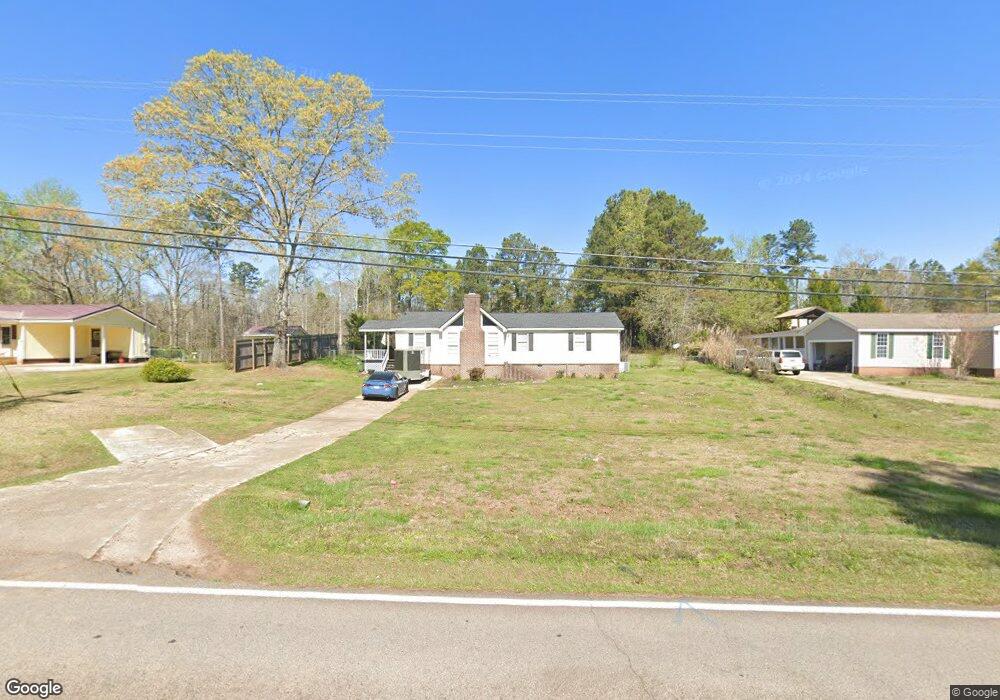
5006 Old West Point Rd Lagrange, GA 30240
Estimated Value: $234,534 - $257,000
4
Beds
2
Baths
2,137
Sq Ft
$113/Sq Ft
Est. Value
About This Home
This home is located at 5006 Old West Point Rd, Lagrange, GA 30240 and is currently estimated at $241,884, approximately $113 per square foot. 5006 Old West Point Rd is a home located in Troup County with nearby schools including Long Cane Elementary School, Berta Weathersbee Elementary School, and Whitesville Road Elementary School.
Ownership History
Date
Name
Owned For
Owner Type
Purchase Details
Closed on
Jul 29, 2010
Sold by
Federal Home Loan Mortgage Corporation
Bought by
Lott Jennifer C
Current Estimated Value
Home Financials for this Owner
Home Financials are based on the most recent Mortgage that was taken out on this home.
Original Mortgage
$52,000
Outstanding Balance
$34,498
Interest Rate
4.61%
Mortgage Type
New Conventional
Estimated Equity
$207,386
Purchase Details
Closed on
Aug 22, 2003
Sold by
Brandy Foster
Bought by
Brandy S Foster
Purchase Details
Closed on
Oct 31, 1997
Sold by
Gary Talley
Bought by
Brandy Foster
Purchase Details
Closed on
May 27, 1983
Bought by
Gary Talley
Purchase Details
Closed on
Jan 17, 1981
Purchase Details
Closed on
May 17, 1977
Purchase Details
Closed on
Feb 25, 1977
Purchase Details
Closed on
May 30, 1975
Purchase Details
Closed on
Jan 1, 1954
Create a Home Valuation Report for This Property
The Home Valuation Report is an in-depth analysis detailing your home's value as well as a comparison with similar homes in the area
Home Values in the Area
Average Home Value in this Area
Purchase History
| Date | Buyer | Sale Price | Title Company |
|---|---|---|---|
| Lott Jennifer C | $65,000 | -- | |
| Brandy S Foster | -- | -- | |
| Brandy Foster | $77,500 | -- | |
| Gary Talley | -- | -- | |
| -- | -- | -- | |
| -- | $35,900 | -- | |
| -- | -- | -- | |
| -- | -- | -- | |
| -- | -- | -- |
Source: Public Records
Mortgage History
| Date | Status | Borrower | Loan Amount |
|---|---|---|---|
| Open | Lott Jennifer C | $52,000 |
Source: Public Records
Tax History Compared to Growth
Tax History
| Year | Tax Paid | Tax Assessment Tax Assessment Total Assessment is a certain percentage of the fair market value that is determined by local assessors to be the total taxable value of land and additions on the property. | Land | Improvement |
|---|---|---|---|---|
| 2024 | $2,053 | $75,280 | $14,000 | $61,280 |
| 2023 | $1,999 | $73,280 | $14,000 | $59,280 |
| 2022 | $1,814 | $65,000 | $10,000 | $55,000 |
| 2021 | $1,504 | $49,880 | $10,000 | $39,880 |
| 2020 | $1,384 | $45,880 | $6,000 | $39,880 |
| 2019 | $1,339 | $44,400 | $6,000 | $38,400 |
| 2018 | $1,093 | $36,240 | $6,000 | $30,240 |
| 2017 | $1,093 | $36,240 | $6,000 | $30,240 |
| 2016 | $1,066 | $35,360 | $6,000 | $29,360 |
| 2015 | $1,050 | $34,760 | $6,000 | $28,760 |
| 2014 | $1,006 | $33,247 | $6,000 | $27,247 |
| 2013 | -- | $34,763 | $6,000 | $28,763 |
Source: Public Records
Map
Nearby Homes
- 0 Hanson Dr Unit 10641272
- 275 Hanson Dr
- 22 Freeman Rd
- 288 Bradfield Dr
- 808 S Fling Rd
- 266 Glass Bridge Rd
- 114 Westgate Dr
- 103 Hawthorne Cir
- 110 Hawthorne Cir
- 1248 Cannonville Rd
- 0 Bradfield Dr Unit 10568803
- 610 Ginger Cir
- 509 Connie Dr
- 102 Foxdale Dr
- 190 Hill Rd
- 0 Robert Hayes Rd Unit 10611067
- 243 Oak Dr
- 124 Foxdale Dr
- 102 Franklin Place
- 119 Plymouth Dr
- 5008 Old West Point Rd
- 5004 Old West Point Rd
- 100 Redwood Dr
- 5010 Old West Point Rd
- 5002 Old West Point Rd
- 101 Redwood Dr
- 102 Redwood Dr
- 5005 Old West Point Rd
- 5012 Old West Point Rd
- 5003 Old West Point Rd
- 5000 Old West Point Rd
- 0 Rob Roy Rd Unit 7375355
- 0 Rob Roy Rd Unit 8205602
- 103 Redwood Dr
- 5001 Old West Point Rd
- 25 George Daniel Rd
- 101 Dakota Dr
- 112 Redwood Dr
- 105 Redwood Dr
- 4006 Old West Point Rd