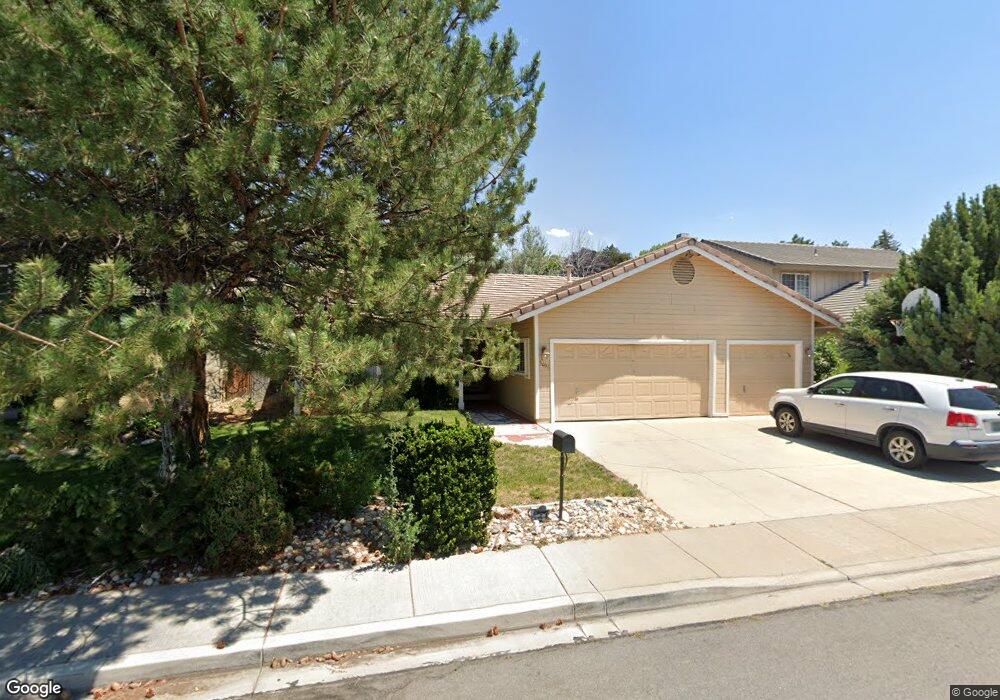
5006 Palo Alto Cir Unit 1 Sparks, NV 89436
Los Altos Parkway NeighborhoodEstimated Value: $555,000 - $612,000
3
Beds
2
Baths
1,854
Sq Ft
$308/Sq Ft
Est. Value
About This Home
This home is located at 5006 Palo Alto Cir Unit 1, Sparks, NV 89436 and is currently estimated at $570,550, approximately $307 per square foot. 5006 Palo Alto Cir Unit 1 is a home located in Washoe County with nearby schools including Bud Beasley Elementary School, Edward C Reed High School, and Excel Christian School.
Ownership History
Date
Name
Owned For
Owner Type
Purchase Details
Closed on
Feb 2, 2009
Sold by
Wiskus Alan D and Wiskus Amanda L
Bought by
Wiskus Alan D and Wiskus Amanda L
Current Estimated Value
Purchase Details
Closed on
Oct 8, 2003
Sold by
Rowe Richard B and Rowe Susan A
Bought by
Wiskus Alan D and Wiskus Amanda L
Home Financials for this Owner
Home Financials are based on the most recent Mortgage that was taken out on this home.
Original Mortgage
$207,920
Outstanding Balance
$90,596
Interest Rate
5.25%
Mortgage Type
Unknown
Estimated Equity
$479,954
Purchase Details
Closed on
Dec 13, 1999
Sold by
Burgess Bruce G and Burgess Julie B
Bought by
Rowe Richard B and Rowe Susan A
Home Financials for this Owner
Home Financials are based on the most recent Mortgage that was taken out on this home.
Original Mortgage
$155,790
Interest Rate
7.82%
Mortgage Type
FHA
Create a Home Valuation Report for This Property
The Home Valuation Report is an in-depth analysis detailing your home's value as well as a comparison with similar homes in the area
Home Values in the Area
Average Home Value in this Area
Purchase History
| Date | Buyer | Sale Price | Title Company |
|---|---|---|---|
| Wiskus Alan D | -- | None Available | |
| Wiskus Alan D | -- | None Available | |
| Wiskus Alan D | $710,666 | Western Title Incorporated | |
| Rowe Richard B | $158,500 | Western Title Inc |
Source: Public Records
Mortgage History
| Date | Status | Borrower | Loan Amount |
|---|---|---|---|
| Open | Wiskus Alan D | $207,920 | |
| Previous Owner | Rowe Richard B | $155,790 | |
| Closed | Wiskus Alan D | $25,990 |
Source: Public Records
Tax History Compared to Growth
Tax History
| Year | Tax Paid | Tax Assessment Tax Assessment Total Assessment is a certain percentage of the fair market value that is determined by local assessors to be the total taxable value of land and additions on the property. | Land | Improvement |
|---|---|---|---|---|
| 2025 | $3,219 | $99,210 | $40,432 | $58,778 |
| 2024 | $3,219 | $97,796 | $38,071 | $59,724 |
| 2023 | $2,983 | $93,762 | $36,775 | $56,988 |
| 2022 | $2,763 | $79,082 | $31,189 | $47,894 |
| 2021 | $2,558 | $70,642 | $22,643 | $47,999 |
| 2020 | $2,405 | $71,031 | $22,610 | $48,421 |
| 2019 | $2,291 | $69,911 | $23,142 | $46,769 |
| 2018 | $2,187 | $62,922 | $16,891 | $46,031 |
| 2017 | $2,099 | $61,994 | $15,628 | $46,366 |
| 2016 | $2,046 | $62,491 | $13,799 | $48,692 |
| 2015 | $2,042 | $61,096 | $12,236 | $48,860 |
| 2014 | $1,982 | $57,767 | $10,341 | $47,426 |
| 2013 | -- | $52,647 | $8,479 | $44,168 |
Source: Public Records
Map
Nearby Homes
- 1560 Freeman Way
- 5276 Santa Rosa Ave
- 1388 Lambrays Ln
- 5105 Santa Anita Dr
- 1550 Istrice Rd
- 1685 Southview Dr
- 1716 Canyon Terrace Dr
- 1304 Lambrusca Dr
- 1215 Ebling Dr
- 4788 Ravello Dr
- 4675 Firtree Ln
- 3693 Vista Blvd
- 4748 Pradera St
- 4393 Acobat Ct
- 4950 San Diego Ct
- 5049 Keams Ct
- 4515 Whitney Cir
- 1484 Serendipity Ct
- 1850 Almonte Ct
- 5436 Vista Terrace Ln Unit 2B
- 5016 Palo Alto Cir
- 4996 Palo Alto Cir
- 4986 Palo Alto Cir Unit 1
- 4999 Santa Barbara Ave
- 5005 Palo Alto Cir
- 4976 Palo Alto Cir
- 5015 Palo Alto Cir
- 5046 Palo Alto Cir
- 4995 Palo Alto Cir
- 4995 Santa Barbara Ave Unit 3
- 5005 Santa Barbara Ave
- 5025 Palo Alto Cir
- 4985 Palo Alto Cir
- 4966 Palo Alto Cir
- 5035 Palo Alto Cir
- 5076 Palo Alto Cir
- 4985 Santa Barbara Ave
- 4975 Palo Alto Cir Unit 1
- 5009 Santa Barbara Ave
- 5096 Palo Alto Cir