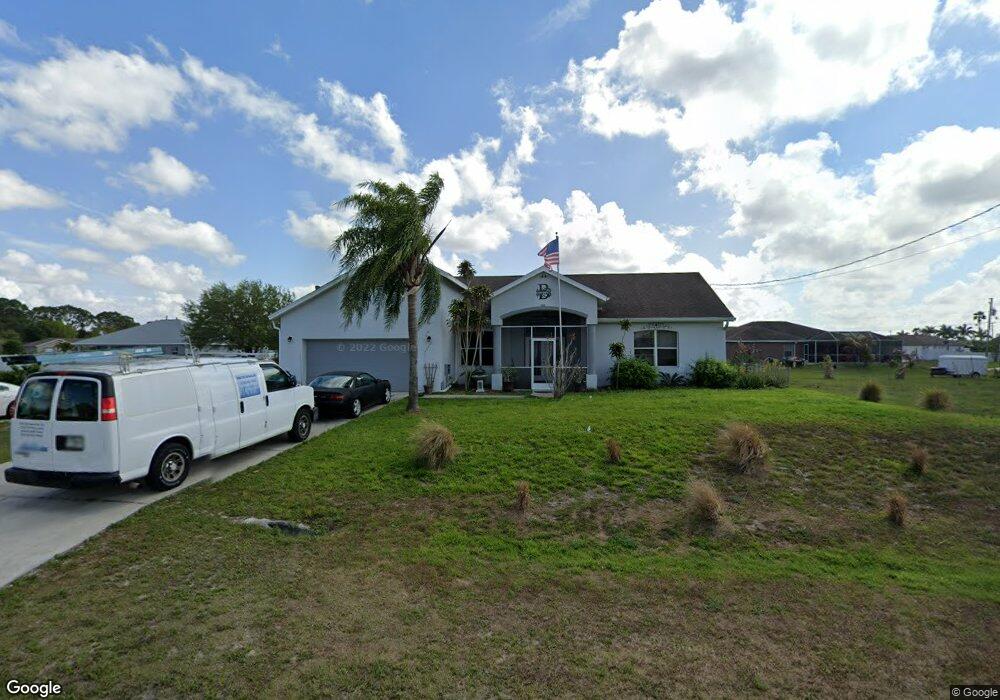
5007 Balmer St Unit 2 Lehigh Acres, FL 33971
Centennial NeighborhoodEstimated Value: $303,000 - $507,000
3
Beds
2
Baths
1,667
Sq Ft
$231/Sq Ft
Est. Value
About This Home
This home is located at 5007 Balmer St Unit 2, Lehigh Acres, FL 33971 and is currently estimated at $384,314, approximately $230 per square foot. 5007 Balmer St Unit 2 is a home located in Lee County with nearby schools including Gateway Elementary School, Lehigh Elementary School, and Tice Elementary School.
Ownership History
Date
Name
Owned For
Owner Type
Purchase Details
Closed on
May 3, 2007
Sold by
Skinner Mazie
Bought by
Skinner Mazie and Burton Paula
Current Estimated Value
Home Financials for this Owner
Home Financials are based on the most recent Mortgage that was taken out on this home.
Original Mortgage
$258,013
Outstanding Balance
$156,341
Interest Rate
6.1%
Mortgage Type
Unknown
Estimated Equity
$227,973
Purchase Details
Closed on
Oct 10, 2003
Sold by
Brenco Const Inc
Bought by
Skinner Mazie
Home Financials for this Owner
Home Financials are based on the most recent Mortgage that was taken out on this home.
Original Mortgage
$135,000
Interest Rate
6.45%
Purchase Details
Closed on
May 6, 2003
Sold by
Cape Holdings Ent Inc
Bought by
Brenco Const Inc
Purchase Details
Closed on
Jan 3, 2003
Sold by
Moine Bruce E
Bought by
Reitan Karen M
Create a Home Valuation Report for This Property
The Home Valuation Report is an in-depth analysis detailing your home's value as well as a comparison with similar homes in the area
Home Values in the Area
Average Home Value in this Area
Purchase History
| Date | Buyer | Sale Price | Title Company |
|---|---|---|---|
| Skinner Mazie | $129,100 | None Available | |
| Skinner Mazie | $162,900 | -- | |
| Brenco Const Inc | $13,400 | -- | |
| Reitan Karen M | $2,000 | -- |
Source: Public Records
Mortgage History
| Date | Status | Borrower | Loan Amount |
|---|---|---|---|
| Open | Skinner Mazie | $258,013 | |
| Closed | Skinner Mazie | $135,000 |
Source: Public Records
Tax History Compared to Growth
Tax History
| Year | Tax Paid | Tax Assessment Tax Assessment Total Assessment is a certain percentage of the fair market value that is determined by local assessors to be the total taxable value of land and additions on the property. | Land | Improvement |
|---|---|---|---|---|
| 2025 | $2,742 | $208,416 | -- | -- |
| 2024 | $2,329 | $196,596 | -- | -- |
| 2023 | $2,630 | $190,870 | $0 | $0 |
| 2022 | $2,329 | $142,326 | $0 | $0 |
| 2021 | $2,025 | $200,388 | $12,297 | $188,091 |
| 2020 | $1,962 | $135,000 | $0 | $0 |
| 2019 | $1,904 | $133,682 | $0 | $0 |
| 2018 | $1,804 | $125,670 | $0 | $0 |
| 2017 | $1,727 | $121,628 | $0 | $0 |
| 2016 | $1,586 | $140,119 | $6,651 | $133,468 |
| 2015 | $1,490 | $124,105 | $4,856 | $119,249 |
| 2014 | $976 | $109,595 | $4,406 | $105,189 |
| 2013 | -- | $91,712 | $3,185 | $88,527 |
Source: Public Records
Map
Nearby Homes
- 1019 Cedartree Ave
- 1021 Cedartree Ave
- 4556 Varsity Cir
- 4560 Varsity Cir
- 1517 Graduate Ct
- 1010 Chauncey Ave
- 1024 Chauncey Ave
- 5029 Bristo St
- 1509 Junior Ct
- 4508 Varsity Cir
- 4504 Varsity Cir
- 1733 Gunnery Rd N
- 1009 Cedartree Ave
- 209 Gunnery Rd N
- 5127 Beecher St
- 4409 Varsity Lakes Dr
- 5129 Baron St
- 5043 Benton St
- 1720 Cornell Ave N
- 1714 Cornell Ave N
- 5005 Balmer St
- 5006 Butte St
- 5004 Butte St
- 5008 Butte St
- 5006 Balmer St
- 5004 Balmer St Unit 2
- 5008 Balmer St
- 5011 Balmer St
- 5002 Butte St
- 5012 Balmer St Unit 2
- 5009 Beecher St
- 5009 Butte St
- 5005 Butte St
- 1003 Cedartree Ave
- 1008 Chauncey Ave
- 5005 Beecher St
- 1006 Chauncey Ave
- 1001 Cedartree Ave
- 1004 Chauncey Ave
- 5011 Beecher St Unit 4