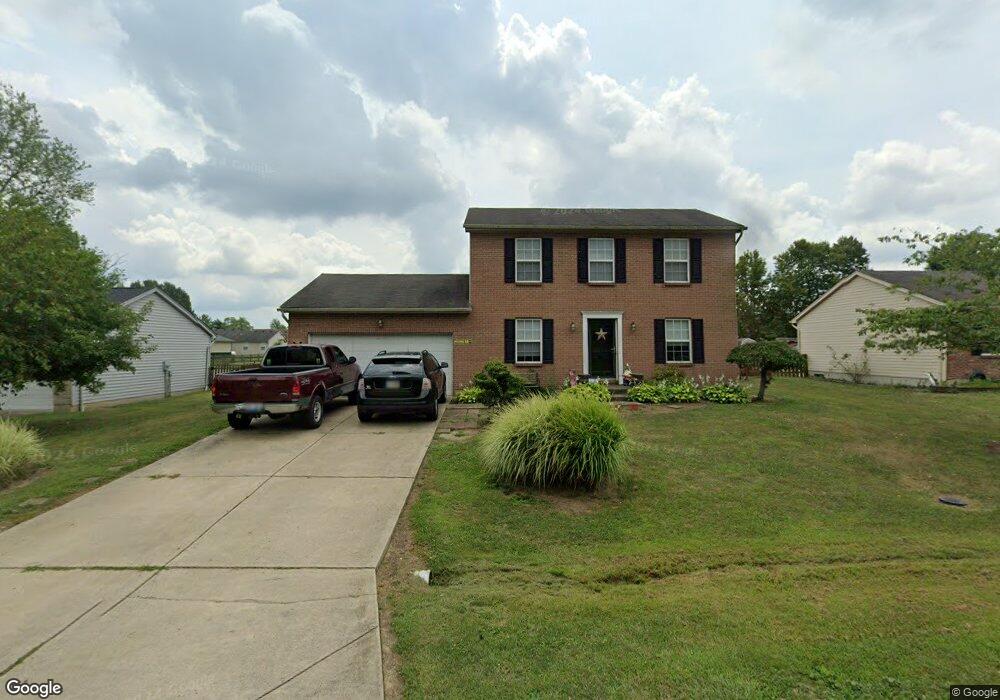
5007 Sean Cir Blanchester, OH 45107
Estimated Value: $269,000 - $347,000
4
Beds
2
Baths
1,536
Sq Ft
$203/Sq Ft
Est. Value
About This Home
This home is located at 5007 Sean Cir, Blanchester, OH 45107 and is currently estimated at $311,620, approximately $202 per square foot. 5007 Sean Cir is a home located in Clinton County with nearby schools including Putman Elementary School, Blanchester Middle School, and Blanchester High School.
Ownership History
Date
Name
Owned For
Owner Type
Purchase Details
Closed on
Jan 14, 2010
Sold by
Baker Tamara Lyn and Baker Tamara Lynn
Bought by
Baker Roger D
Current Estimated Value
Purchase Details
Closed on
Apr 29, 2008
Sold by
Baker Roger D and Baker Tamara Lynn
Bought by
Baker Roger D
Purchase Details
Closed on
Mar 15, 2005
Sold by
Wabnitz Construction Inc
Bought by
Baker Roger D and Baker Tamara Lynn
Home Financials for this Owner
Home Financials are based on the most recent Mortgage that was taken out on this home.
Original Mortgage
$114,800
Interest Rate
7%
Mortgage Type
Stand Alone First
Purchase Details
Closed on
Feb 16, 2005
Sold by
Wabnitz Construction Inc
Bought by
Baker Roger D and Baker Tamara Lynn
Home Financials for this Owner
Home Financials are based on the most recent Mortgage that was taken out on this home.
Original Mortgage
$114,800
Interest Rate
7%
Mortgage Type
Stand Alone First
Create a Home Valuation Report for This Property
The Home Valuation Report is an in-depth analysis detailing your home's value as well as a comparison with similar homes in the area
Home Values in the Area
Average Home Value in this Area
Purchase History
| Date | Buyer | Sale Price | Title Company |
|---|---|---|---|
| Baker Roger D | -- | -- | |
| Baker Roger D | -- | -- | |
| Baker Roger D | $167,416 | -- | |
| Baker Roger D | $167,416 | Jets Title Agency Llc |
Source: Public Records
Mortgage History
| Date | Status | Borrower | Loan Amount |
|---|---|---|---|
| Previous Owner | Baker Roger D | $114,800 | |
| Closed | Baker Roger D | $28,700 |
Source: Public Records
Tax History
| Year | Tax Paid | Tax Assessment Tax Assessment Total Assessment is a certain percentage of the fair market value that is determined by local assessors to be the total taxable value of land and additions on the property. | Land | Improvement |
|---|---|---|---|---|
| 2024 | $2,904 | $82,390 | $4,760 | $77,630 |
| 2023 | $3,083 | $82,390 | $4,760 | $77,630 |
| 2022 | $3,006 | $72,740 | $3,230 | $69,510 |
| 2021 | $3,151 | $72,740 | $3,230 | $69,510 |
| 2020 | $3,141 | $72,740 | $3,230 | $69,510 |
| 2019 | $2,141 | $48,060 | $3,500 | $44,560 |
| 2018 | $2,150 | $48,060 | $3,500 | $44,560 |
| 2017 | $2,105 | $48,060 | $3,500 | $44,560 |
| 2016 | $1,596 | $38,200 | $5,470 | $32,730 |
| 2015 | $1,596 | $38,200 | $5,470 | $32,730 |
| 2013 | $1,645 | $38,200 | $5,470 | $32,730 |
Source: Public Records
Map
Nearby Homes
- 5000 Sean Cir
- 5002 Sean Cir
- 5003 Sean Cir
- 5001 Sean Cir
- 5010 Sean Cir
- 7279 Fairground Rd
- 7403 Fairground Rd
- 506 Cherry St
- 510 Cherry St
- 508 Cherry St
- 501 S Wright St
- 0 Ohio 123 Unit 11 938995
- 0 Ohio 123 Unit 1848086
- 503 S Broadway St
- 7636 Rosewood Dr
- 308 S Broadway St
- 816 E Center St
- 305 E Main St
- 143 W Fancy St
- 203 E Main St
Your Personal Tour Guide
Ask me questions while you tour the home.