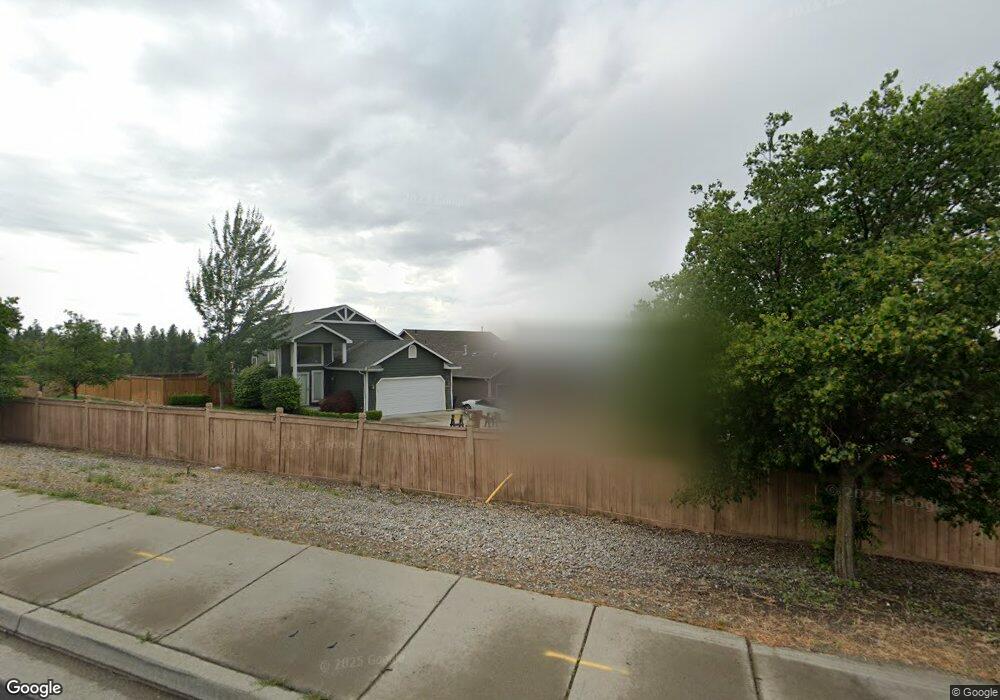
5007 W Prosperity Ln Spokane, WA 99208
North Indian Trail NeighborhoodEstimated Value: $385,260 - $465,000
4
Beds
2
Baths
960
Sq Ft
$439/Sq Ft
Est. Value
About This Home
This home is located at 5007 W Prosperity Ln, Spokane, WA 99208 and is currently estimated at $421,065, approximately $438 per square foot. 5007 W Prosperity Ln is a home located in Spokane County with nearby schools including Balboa Elementary School, Salk Middle School, and North Central High School.
Ownership History
Date
Name
Owned For
Owner Type
Purchase Details
Closed on
Apr 30, 2015
Sold by
Bell Stephanie
Bought by
Bell Greg
Current Estimated Value
Purchase Details
Closed on
Mar 14, 2005
Sold by
Wallingford Keith D
Bought by
Bell Greg B and Bell Stephanie J
Home Financials for this Owner
Home Financials are based on the most recent Mortgage that was taken out on this home.
Original Mortgage
$136,213
Outstanding Balance
$69,056
Interest Rate
5.61%
Mortgage Type
FHA
Estimated Equity
$352,009
Purchase Details
Closed on
Dec 9, 2004
Sold by
Wallingford Brooke
Bought by
Wallingford Keith D
Purchase Details
Closed on
Jan 19, 2001
Sold by
Hayden Enterprises Inc
Bought by
Wallingford Keith D
Home Financials for this Owner
Home Financials are based on the most recent Mortgage that was taken out on this home.
Original Mortgage
$90,765
Interest Rate
7.41%
Create a Home Valuation Report for This Property
The Home Valuation Report is an in-depth analysis detailing your home's value as well as a comparison with similar homes in the area
Home Values in the Area
Average Home Value in this Area
Purchase History
| Date | Buyer | Sale Price | Title Company |
|---|---|---|---|
| Bell Greg | -- | None Available | |
| Bell Greg B | $138,374 | Transnation Title | |
| Wallingford Keith D | -- | -- | |
| Wallingford Keith D | $98,264 | Transnation Title Insurance |
Source: Public Records
Mortgage History
| Date | Status | Borrower | Loan Amount |
|---|---|---|---|
| Open | Bell Greg B | $136,213 | |
| Previous Owner | Wallingford Keith D | $90,765 |
Source: Public Records
Tax History Compared to Growth
Tax History
| Year | Tax Paid | Tax Assessment Tax Assessment Total Assessment is a certain percentage of the fair market value that is determined by local assessors to be the total taxable value of land and additions on the property. | Land | Improvement |
|---|---|---|---|---|
| 2025 | $3,366 | $358,400 | $95,000 | $263,400 |
| 2024 | $3,366 | $339,000 | $75,000 | $264,000 |
| 2023 | $3,298 | $339,500 | $65,000 | $274,500 |
| 2022 | $3,148 | $337,000 | $65,000 | $272,000 |
| 2021 | $2,871 | $241,200 | $45,000 | $196,200 |
| 2020 | $2,552 | $206,500 | $35,000 | $171,500 |
| 2019 | $2,280 | $190,600 | $30,000 | $160,600 |
| 2018 | $2,473 | $177,700 | $30,000 | $147,700 |
| 2017 | $2,186 | $159,900 | $30,000 | $129,900 |
| 2016 | $2,088 | $149,400 | $30,000 | $119,400 |
| 2015 | $2,091 | $146,400 | $30,000 | $116,400 |
| 2014 | -- | $148,900 | $30,000 | $118,900 |
| 2013 | -- | $0 | $0 | $0 |
Source: Public Records
Map
Nearby Homes
- 5019 W Prosperity Ln
- 5115 W Pacific Park Dr
- 8451 N James Ct
- 8643 N James Dr
- 8501 N Tessa St
- 8428 N Susan Ct
- 4750 W Lex Ave
- 8301 N Upper Mayes Ln
- 8603 N Upper Mayes Ln
- 4752 W Derek Ave Unit Lot 31
- 4706 W Lex Ave Unit Lot 5
- 8619 N Jodi St
- 8510 N Jodi St
- 8311 N Greenwood Ct
- 8908 N Pamela St
- 4210 W Pine Cliff Dr
- 8907 N Rustle
- 4682 W Lowell Ave
- 9221 N Londale Dr
- 9208 N Seminole Dr
- 5011 W Prosperity Ln
- 5003 W Prosperity Ln
- 5010 W Prosperity Ln
- 5014 W Prosperity Ln
- 5018 W Prosperity Ln
- 5023 W Prosperity Ln
- 5022 W Prosperity Ln
- 5027 W Prosperity Ln
- 5026 W Prosperity Ln
- 5031 W Prosperity Ln
- 8335 N Farmdale Ct
- 5007 W Pacific Park Dr
- 5035 W Prosperity Ln
- 5003 W Pacific Park Dr
- 5011 W Pacific Park Dr
- 5023 W Pacific Park Dr
- 5019 W Pacific Park Dr
- 5027 W Pacific Park Dr
- 8388 N Farmdale Ct
- 5031 W Pacific Park Dr