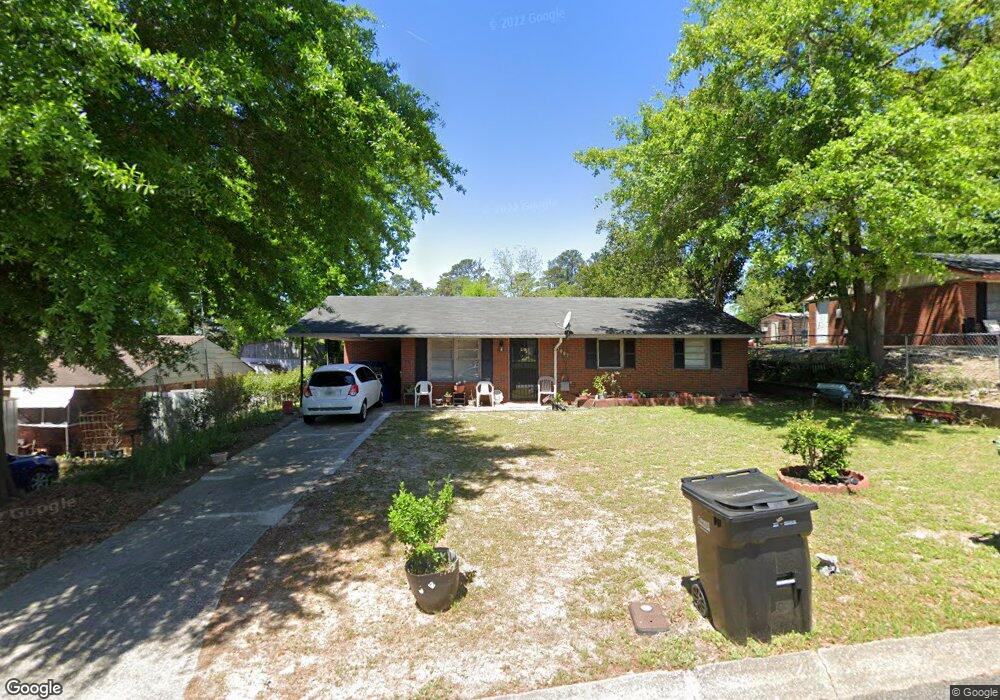
5007 Wellborn Dr Columbus, GA 31907
East Columbus NeighborhoodEstimated Value: $76,000 - $97,000
3
Beds
1
Bath
950
Sq Ft
$88/Sq Ft
Est. Value
About This Home
This home is located at 5007 Wellborn Dr, Columbus, GA 31907 and is currently estimated at $83,727, approximately $88 per square foot. 5007 Wellborn Dr is a home located in Muscogee County with nearby schools including Wesley Heights Elementary School, Rothschild Leadership Academy, and Kendrick High School.
Ownership History
Date
Name
Owned For
Owner Type
Purchase Details
Closed on
Jun 26, 2007
Sold by
Lr Partners Llc
Bought by
Daniels Jimmy L and Taylor Alice M
Current Estimated Value
Home Financials for this Owner
Home Financials are based on the most recent Mortgage that was taken out on this home.
Original Mortgage
$74,333
Outstanding Balance
$45,629
Interest Rate
6.16%
Mortgage Type
Purchase Money Mortgage
Estimated Equity
$38,098
Purchase Details
Closed on
Feb 26, 2007
Sold by
R P Investment Group Llc
Bought by
Lr Partners Llc
Home Financials for this Owner
Home Financials are based on the most recent Mortgage that was taken out on this home.
Original Mortgage
$51,300
Interest Rate
6.08%
Mortgage Type
Unknown
Purchase Details
Closed on
Feb 7, 2007
Sold by
Moffett Dorothy Diann
Bought by
Rp Investment Group Llc
Home Financials for this Owner
Home Financials are based on the most recent Mortgage that was taken out on this home.
Original Mortgage
$51,300
Interest Rate
6.08%
Mortgage Type
Unknown
Create a Home Valuation Report for This Property
The Home Valuation Report is an in-depth analysis detailing your home's value as well as a comparison with similar homes in the area
Home Values in the Area
Average Home Value in this Area
Purchase History
| Date | Buyer | Sale Price | Title Company |
|---|---|---|---|
| Daniels Jimmy L | $75,500 | None Available | |
| Lr Partners Llc | $46,500 | None Available | |
| Rp Investment Group Llc | $37,000 | None Available |
Source: Public Records
Mortgage History
| Date | Status | Borrower | Loan Amount |
|---|---|---|---|
| Open | Daniels Jimmy L | $74,333 | |
| Previous Owner | Rp Investment Group Llc | $51,300 |
Source: Public Records
Tax History
| Year | Tax Paid | Tax Assessment Tax Assessment Total Assessment is a certain percentage of the fair market value that is determined by local assessors to be the total taxable value of land and additions on the property. | Land | Improvement |
|---|---|---|---|---|
| 2025 | $652 | $26,500 | $5,524 | $20,976 |
| 2024 | $651 | $26,500 | $5,524 | $20,976 |
| 2023 | $25 | $26,500 | $5,524 | $20,976 |
| 2022 | $678 | $22,188 | $5,524 | $16,664 |
| 2021 | $672 | $17,964 | $5,524 | $12,440 |
| 2020 | $672 | $17,964 | $5,524 | $12,440 |
| 2019 | $676 | $17,964 | $5,524 | $12,440 |
| 2018 | $676 | $17,964 | $5,524 | $12,440 |
| 2017 | $680 | $17,964 | $5,524 | $12,440 |
| 2016 | $684 | $29,842 | $3,900 | $25,942 |
| 2015 | $685 | $29,842 | $3,900 | $25,942 |
| 2014 | $686 | $29,842 | $3,900 | $25,942 |
| 2013 | -- | $29,842 | $3,900 | $25,942 |
Source: Public Records
Map
Nearby Homes
- 4910 Wellborn Dr
- 5029 Kingsberry Ln
- 5142 Delray Dr
- 1354 Floyd Rd
- 4937 Gardiner Dr
- 1333 Floyd Rd
- 5010 Kingston Dr
- 5035 Gibbs Dr
- 2307 Skylake Dr
- 4642 Wellborn Dr
- 5429 Susan Ln
- 5759 Forrest Rd
- 5725 Marlette Ct
- 5100 Buckingham Ct
- 2401 Skylake Dr
- 5637 Teresa St
- 2500 Water Oak Dr
- 5773 Marlette Ct
- 2505 White Chapel Dr
- 5802 Blueridge Dr
- 5001 Wellborn Dr
- 5013 Wellborn Dr
- 5019 Wellborn Dr
- 4953 Wellborn Dr
- 5254 Eton Dr
- 5250 Eton Dr
- 1530 Hagan Dr
- 5260 Eton Dr
- 5244 Eton Dr
- 5010 Wellborn Dr
- 5023 Wellborn Dr
- 4947 Wellborn Dr
- 5266 Eton Dr
- 5016 Wellborn Dr
- 1529 Hagan Dr
- 1524 Hagan Dr
- 4941 Wellborn Dr
- 5027 Wellborn Dr
- 5022 Wellborn Dr
- 5238 Eton Dr
Your Personal Tour Guide
Ask me questions while you tour the home.