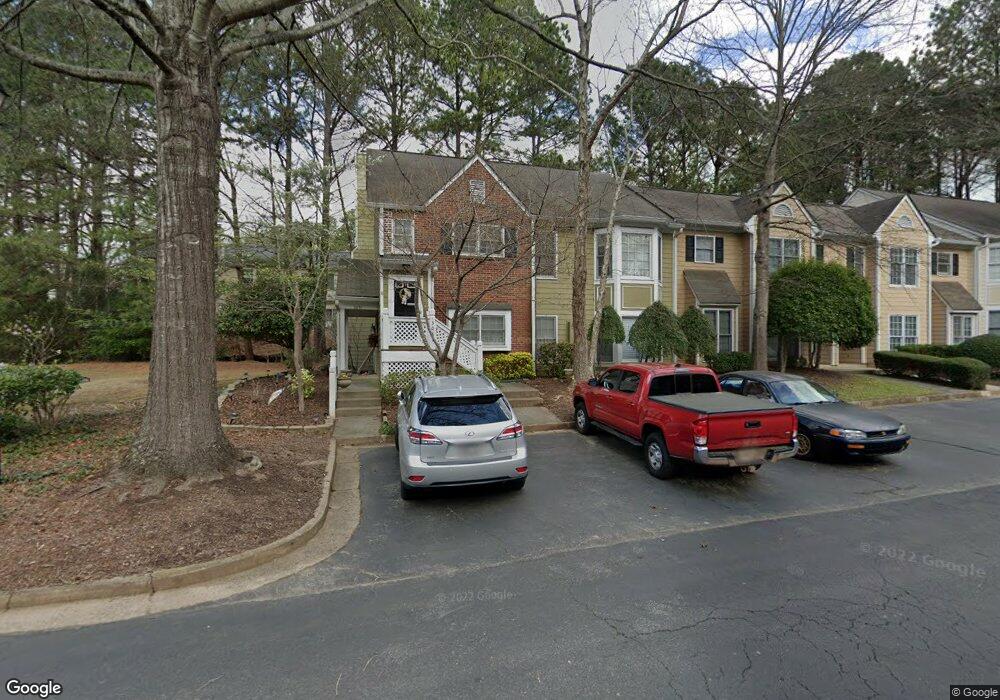
5008 Camden Way Alpharetta, GA 30005
Estimated Value: $294,099 - $347,000
2
Beds
2
Baths
1,266
Sq Ft
$249/Sq Ft
Est. Value
About This Home
This home is located at 5008 Camden Way, Alpharetta, GA 30005 and is currently estimated at $315,275, approximately $249 per square foot. 5008 Camden Way is a home located in Fulton County with nearby schools including New Prospect Elementary School, Webb Bridge Middle School, and Alpharetta High School.
Ownership History
Date
Name
Owned For
Owner Type
Purchase Details
Closed on
Apr 23, 2019
Sold by
Hunt Austin
Bought by
Tucker Alyse
Current Estimated Value
Home Financials for this Owner
Home Financials are based on the most recent Mortgage that was taken out on this home.
Original Mortgage
$165,600
Outstanding Balance
$144,694
Interest Rate
4%
Mortgage Type
New Conventional
Estimated Equity
$170,581
Purchase Details
Closed on
Oct 20, 2017
Sold by
Gautam Siddhartha
Bought by
Hunt Austin
Home Financials for this Owner
Home Financials are based on the most recent Mortgage that was taken out on this home.
Original Mortgage
$168,000
Interest Rate
3.83%
Mortgage Type
New Conventional
Purchase Details
Closed on
Nov 1, 2013
Sold by
Bochicchio Karlyn
Bought by
Gautam Siddhartha and Hendricks Courtney
Purchase Details
Closed on
Sep 30, 2011
Sold by
Of Hud
Bought by
Bochicchio Karlyn
Create a Home Valuation Report for This Property
The Home Valuation Report is an in-depth analysis detailing your home's value as well as a comparison with similar homes in the area
Home Values in the Area
Average Home Value in this Area
Purchase History
| Date | Buyer | Sale Price | Title Company |
|---|---|---|---|
| Tucker Alyse | $184,000 | -- | |
| Hunt Austin | $180,000 | -- | |
| Gautam Siddhartha | $89,000 | -- | |
| Bochicchio Karlyn | $43,050 | -- |
Source: Public Records
Mortgage History
| Date | Status | Borrower | Loan Amount |
|---|---|---|---|
| Open | Tucker Alyse | $165,600 | |
| Previous Owner | Hunt Austin | $168,000 |
Source: Public Records
Tax History Compared to Growth
Tax History
| Year | Tax Paid | Tax Assessment Tax Assessment Total Assessment is a certain percentage of the fair market value that is determined by local assessors to be the total taxable value of land and additions on the property. | Land | Improvement |
|---|---|---|---|---|
| 2025 | $187 | $104,840 | $31,400 | $73,440 |
| 2023 | $2,790 | $98,840 | $13,520 | $85,320 |
| 2022 | $1,415 | $86,600 | $12,880 | $73,720 |
| 2021 | $1,535 | $72,240 | $9,440 | $62,800 |
| 2020 | $1,737 | $69,400 | $8,880 | $60,520 |
| 2019 | $63 | $68,160 | $8,720 | $59,440 |
| 2018 | $1,045 | $59,960 | $8,200 | $51,760 |
| 2017 | $873 | $29,920 | $3,240 | $26,680 |
| 2016 | $873 | $29,920 | $3,240 | $26,680 |
| 2015 | $1,049 | $29,920 | $3,240 | $26,680 |
| 2014 | $917 | $29,920 | $3,240 | $26,680 |
Source: Public Records
Map
Nearby Homes
- 3027 Camden Way
- 3015 Camden Way
- 3087 Camden Way
- 5008 Avalon Dr
- 1005 Whitestone Ridge
- 3750 Brookside Pkwy Unit 37413033
- 1230 Whitestone Ridge Unit 1
- 535 Tumbling Creek Dr Unit 6
- 4345 Park Brooke Trace
- 4255 Park Brooke Trace
- 3010 Brooke View Ct Unit 5
- 4465 Park Brooke Trace Unit 5
- 635 Park Creek Trace
- 870 Longstone Landing
- 437 Argosy Park Cir
- 3965 Brookline Dr
- 3962 Erin Dr
- 1585 Spinnaker Dr
- 345 Kincardine Way Unit IIIA
- 3090 Camden Way
- 3086 Camden Way
- 3084 Camden Way
- 3082 Camden Way
- 4012 Camden Way
- 5008 Camden Way Unit 5008
- 3023 Camden Way
- 3091 Camden Way Unit 3091
- 5041 Avalon Dr
- 4000 Camden Way
- 5030 Avalon Dr
- 3070 Camden Way
- 5071 Avalon Dr
- 0 Camden Way Unit 7069750
- 0 Camden Way Unit 7052551
- 0 Camden Way Unit 7115673
- 0 Camden Way Unit 3285083
- 0 Camden Way Unit 3239461
- 0 Camden Way Unit 3162088
- 0 Camden Way Unit 8170859