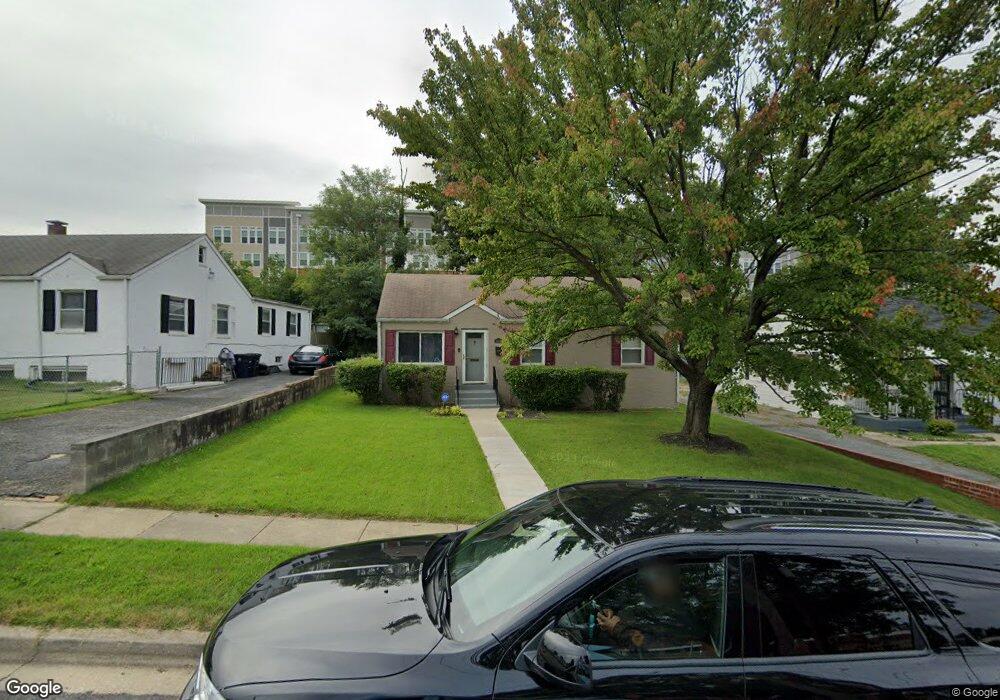
5008 N Englewood Dr Capitol Heights, MD 20743
Estimated Value: $252,000 - $386,000
--
Bed
1
Bath
1,350
Sq Ft
$244/Sq Ft
Est. Value
About This Home
This home is located at 5008 N Englewood Dr, Capitol Heights, MD 20743 and is currently estimated at $330,044, approximately $244 per square foot. 5008 N Englewood Dr is a home located in Prince George's County with nearby schools including Robert R. Gray Elementary School, G. James Gholson Middle School, and Fairmont Heights High School.
Ownership History
Date
Name
Owned For
Owner Type
Purchase Details
Closed on
Oct 11, 2006
Sold by
Howard Katrice
Bought by
Heath Katrice S and Heath Clifford J
Current Estimated Value
Home Financials for this Owner
Home Financials are based on the most recent Mortgage that was taken out on this home.
Original Mortgage
$174,600
Outstanding Balance
$114,879
Interest Rate
8.5%
Mortgage Type
Stand Alone Refi Refinance Of Original Loan
Estimated Equity
$215,165
Purchase Details
Closed on
Aug 29, 2006
Sold by
Howard Katrice
Bought by
Heath Katrice S and Heath Clifford J
Home Financials for this Owner
Home Financials are based on the most recent Mortgage that was taken out on this home.
Original Mortgage
$174,600
Outstanding Balance
$114,879
Interest Rate
8.5%
Mortgage Type
Stand Alone Refi Refinance Of Original Loan
Estimated Equity
$215,165
Purchase Details
Closed on
Oct 3, 2001
Sold by
Washington Mutual Bank Fa
Bought by
Howard Katrice
Purchase Details
Closed on
May 11, 2000
Sold by
Webb Jacqueline
Bought by
Washington Mutual Bank Fa and B35 Ptx
Purchase Details
Closed on
Jun 17, 1999
Sold by
Pickett John T
Bought by
Webb Jacqueline
Create a Home Valuation Report for This Property
The Home Valuation Report is an in-depth analysis detailing your home's value as well as a comparison with similar homes in the area
Home Values in the Area
Average Home Value in this Area
Purchase History
| Date | Buyer | Sale Price | Title Company |
|---|---|---|---|
| Heath Katrice S | -- | -- | |
| Heath Katrice S | -- | -- | |
| Howard Katrice | $99,900 | -- | |
| Washington Mutual Bank Fa | $108,000 | -- | |
| Webb Jacqueline | $125,000 | -- |
Source: Public Records
Mortgage History
| Date | Status | Borrower | Loan Amount |
|---|---|---|---|
| Open | Heath Katrice S | $174,600 | |
| Closed | Heath Katrice S | $174,600 |
Source: Public Records
Tax History Compared to Growth
Tax History
| Year | Tax Paid | Tax Assessment Tax Assessment Total Assessment is a certain percentage of the fair market value that is determined by local assessors to be the total taxable value of land and additions on the property. | Land | Improvement |
|---|---|---|---|---|
| 2025 | $4,237 | $275,933 | -- | -- |
| 2024 | $4,237 | $258,267 | $0 | $0 |
| 2023 | $3,973 | $240,600 | $65,300 | $175,300 |
| 2022 | $3,747 | $225,367 | $0 | $0 |
| 2021 | $3,520 | $210,133 | $0 | $0 |
| 2020 | $3,294 | $194,900 | $45,100 | $149,800 |
| 2019 | $3,186 | $187,600 | $0 | $0 |
| 2018 | $3,077 | $180,300 | $0 | $0 |
| 2017 | $2,969 | $173,000 | $0 | $0 |
| 2016 | -- | $153,633 | $0 | $0 |
| 2015 | $2,130 | $134,267 | $0 | $0 |
| 2014 | $2,130 | $114,900 | $0 | $0 |
Source: Public Records
Map
Nearby Homes
- 1312 Dunbar Oaks Dr
- 1315 Chapelwood Ln
- 4810 Leroy Gorham Dr
- 1400 Farmingdale Ave
- 5014 Leroy Gorham Dr
- 5304 Sheriff Rd
- 1327 Eastern Ave
- 5302 Sheriff Rd
- 6007 State St
- 5605 Kolb St
- 948 Eastern Ave NE Unit 3
- 1101 51st Place NE
- 5704 L St
- 948 Division Ave NE
- 1034 58th Ave
- 923 57th Place
- 926 52nd St NE
- 5805 Beecher St
- 924 52nd St NE
- 4920 Nash St NE
- 5010 N Englewood Dr
- 5006 N Englewood Dr
- 5012 N Englewood Dr
- 5002 N Englewood Dr
- 5014 N Englewood Dr
- 5005 N Englewood Dr
- 5016 N Englewood Dr
- 5003 N Englewood Dr
- 1424 Nye St
- 5001 N Englewood Dr
- 5018 N Englewood Dr
- 5002 Addison Rd
- 1422 Nye St
- 5004 Addison Rd
- 1420 Nye St
- 5022 N Englewood Dr
- 5006 Addison Rd
- 5001 Addison Rd
- 1418 Nye St
- 5024 N Englewood Dr