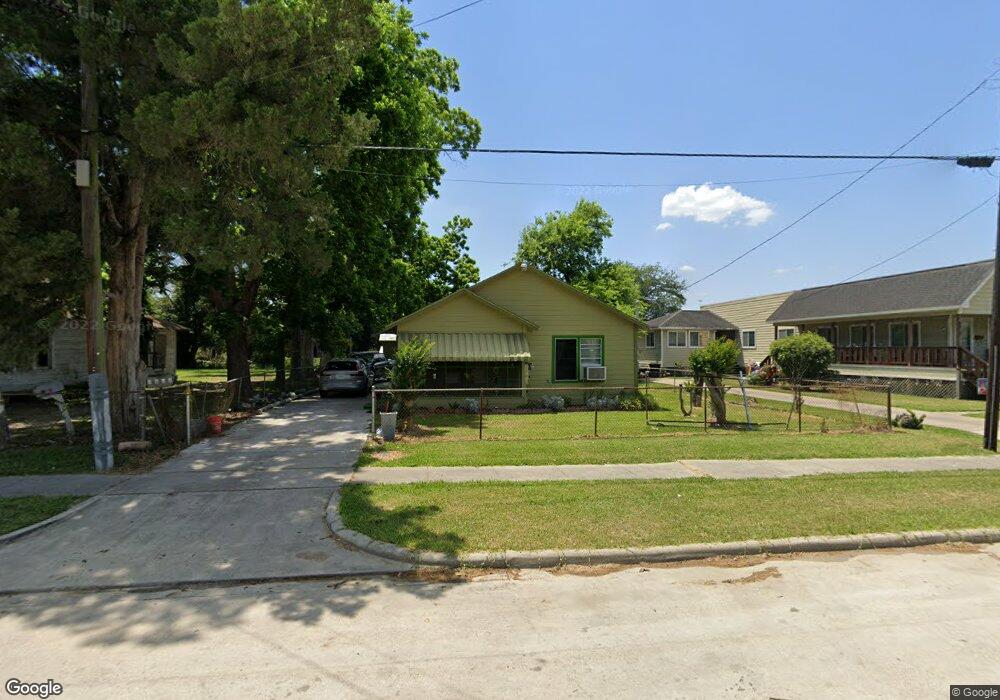
5009 Pickfair St Houston, TX 77026
Kashmere Gardens NeighborhoodEstimated Value: $181,000 - $212,000
3
Beds
1
Bath
1,286
Sq Ft
$150/Sq Ft
Est. Value
About This Home
This home is located at 5009 Pickfair St, Houston, TX 77026 and is currently estimated at $192,508, approximately $149 per square foot. 5009 Pickfair St is a home located in Harris County with nearby schools including Kashmere Gardens Elementary School, Key Middle, and Kashmere High School.
Ownership History
Date
Name
Owned For
Owner Type
Purchase Details
Closed on
Nov 8, 2022
Sold by
Arbor Alana
Bought by
Arbor Alana and Arbor Melvin
Current Estimated Value
Purchase Details
Closed on
Nov 30, 2020
Sold by
Fairow Jeffery
Bought by
Arbor Alana
Purchase Details
Closed on
Jan 22, 2020
Sold by
Jackson Edgar
Bought by
Arbor Alana
Purchase Details
Closed on
Jan 21, 2020
Sold by
Boudoin Leo
Bought by
Arbor Alana
Purchase Details
Closed on
Dec 23, 2019
Sold by
Jackson Ronald J
Bought by
Arbor Alana
Purchase Details
Closed on
Apr 9, 2019
Sold by
Walker Tammy B
Bought by
Arbor Alana
Purchase Details
Closed on
Mar 13, 2019
Sold by
Zenon Linnette and Boudoin Sheleen
Bought by
Arbor Alana
Purchase Details
Closed on
Mar 5, 2019
Sold by
Jackson Victoria
Bought by
Arbor Alana
Purchase Details
Closed on
Mar 16, 2016
Sold by
Jackson Victoria
Bought by
Jackson Edgar
Create a Home Valuation Report for This Property
The Home Valuation Report is an in-depth analysis detailing your home's value as well as a comparison with similar homes in the area
Home Values in the Area
Average Home Value in this Area
Purchase History
| Date | Buyer | Sale Price | Title Company |
|---|---|---|---|
| Arbor Alana | -- | -- | |
| Arbor Alana | -- | None Available | |
| Arbor Alana | -- | None Listed On Document | |
| Arbor Alana | -- | None Listed On Document | |
| Arbor Alana | -- | None Available | |
| Arbor Alana | -- | None Available | |
| Arbor Alana | -- | None Available | |
| Arbor Alana | -- | None Available | |
| Arbor Alana | -- | None Listed On Document | |
| Arbor Alana | -- | None Available | |
| Arbor Alana | -- | None Listed On Document | |
| Jackson Edgar | -- | None Available |
Source: Public Records
Tax History Compared to Growth
Tax History
| Year | Tax Paid | Tax Assessment Tax Assessment Total Assessment is a certain percentage of the fair market value that is determined by local assessors to be the total taxable value of land and additions on the property. | Land | Improvement |
|---|---|---|---|---|
| 2025 | $27 | $223,735 | $77,457 | $146,278 |
| 2024 | $27 | $225,700 | $77,457 | $148,243 |
| 2023 | $27 | $215,653 | $70,875 | $144,778 |
| 2022 | $3,568 | $162,041 | $50,625 | $111,416 |
| 2021 | $3,003 | $128,848 | $35,438 | $93,410 |
| 2020 | $2,455 | $101,380 | $35,438 | $65,942 |
| 2019 | $1,332 | $52,656 | $20,250 | $32,406 |
| 2018 | $1,167 | $46,108 | $20,250 | $25,858 |
| 2017 | $1,653 | $65,386 | $20,250 | $45,136 |
| 2016 | $1,575 | $62,281 | $15,188 | $47,093 |
| 2015 | $943 | $51,485 | $10,125 | $41,360 |
| 2014 | $943 | $51,485 | $10,125 | $41,360 |
Source: Public Records
Map
Nearby Homes
- 5013 Pardee St
- 4916 Lavender St
- 4818 Lavender St
- 5210 Pickfair St
- 5217 Pickfair St
- 4717 Pickfair St
- 5419 Pardee St
- 4921 Wipprecht St
- 4612 Pickfair B St
- 4612 Pickfair D St
- 4612 Pickfair C St
- 0 Wipprecht St Unit 16984812
- 5514 Pardee St
- 4921 Kashmere St
- 5609 Pickfair St
- 5305 Kashmere St
- 4211 Kashmere St
- 0 Kashmere St
- 5526 Bunte St
- 4914 Cavalcade St
- 5005 Pickfair St
- 5013 Pickfair St
- 5103 Pardee St
- 4921 Pickfair St
- 5102 Pickfair St
- 5102 Pardee St
- 4911 Pickfair St
- 4922 Lavender St
- 4909 Pickfair St
- 5000 Lavender St
- 5203 Pickfair St
- 5004 Lavender St
- 4907 Pickfair St
- 5020 Lavender St
- 4918 Lavender St
- 4905 Pickfair St
- 5202 Pickfair St
- 5114 Lavender St
- 4910 Lavender St
- 4914 Lavender St