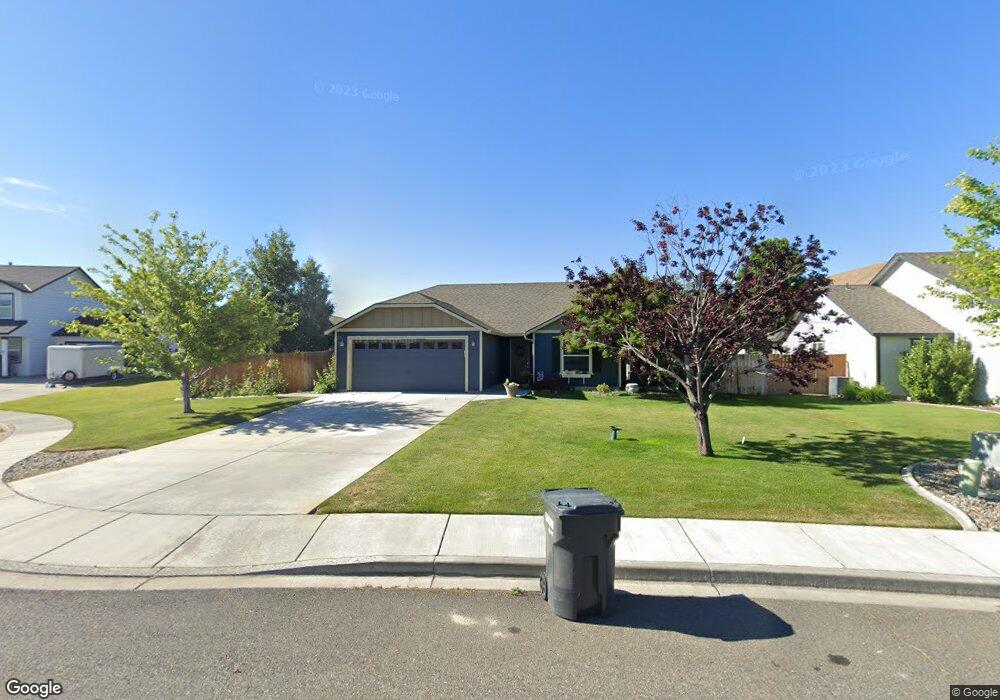
5009 S Desert Dove Loop West Richland, WA 99353
Estimated Value: $432,167 - $467,000
3
Beds
2
Baths
1,786
Sq Ft
$254/Sq Ft
Est. Value
About This Home
This home is located at 5009 S Desert Dove Loop, West Richland, WA 99353 and is currently estimated at $454,042, approximately $254 per square foot. 5009 S Desert Dove Loop is a home located in Benton County with nearby schools including Wiley Elementary School, Enterprise Middle School, and Hanford High School.
Ownership History
Date
Name
Owned For
Owner Type
Purchase Details
Closed on
Sep 29, 2022
Sold by
Linda Scannell
Bought by
Poletski Richard and Poletski Dama
Current Estimated Value
Home Financials for this Owner
Home Financials are based on the most recent Mortgage that was taken out on this home.
Original Mortgage
$140,000
Outstanding Balance
$134,356
Interest Rate
5.66%
Mortgage Type
New Conventional
Estimated Equity
$319,686
Purchase Details
Closed on
May 1, 2006
Sold by
Hayden Enterprises Inc
Bought by
Scannell Linda
Home Financials for this Owner
Home Financials are based on the most recent Mortgage that was taken out on this home.
Original Mortgage
$88,000
Interest Rate
6.29%
Mortgage Type
Fannie Mae Freddie Mac
Create a Home Valuation Report for This Property
The Home Valuation Report is an in-depth analysis detailing your home's value as well as a comparison with similar homes in the area
Home Values in the Area
Average Home Value in this Area
Purchase History
| Date | Buyer | Sale Price | Title Company |
|---|---|---|---|
| Poletski Richard | -- | Benton Franklin Title | |
| Scannell Linda | $168,000 | Chicago Title |
Source: Public Records
Mortgage History
| Date | Status | Borrower | Loan Amount |
|---|---|---|---|
| Open | Poletski Richard | $140,000 | |
| Previous Owner | Scannell Linda | $88,000 |
Source: Public Records
Tax History Compared to Growth
Tax History
| Year | Tax Paid | Tax Assessment Tax Assessment Total Assessment is a certain percentage of the fair market value that is determined by local assessors to be the total taxable value of land and additions on the property. | Land | Improvement |
|---|---|---|---|---|
| 2024 | $4,536 | $373,190 | $95,000 | $278,190 |
| 2023 | $4,536 | $394,980 | $50,000 | $344,980 |
| 2022 | $732 | $179,020 | $40,000 | $139,020 |
| 2021 | $764 | $179,020 | $40,000 | $139,020 |
| 2020 | $763 | $262,290 | $50,000 | $212,290 |
| 2019 | $795 | $253,450 | $50,000 | $203,450 |
| 2018 | $2,815 | $206,820 | $40,000 | $166,820 |
| 2017 | $2,528 | $179,020 | $40,000 | $139,020 |
| 2016 | $2,414 | $179,020 | $40,000 | $139,020 |
| 2015 | $2,326 | $179,020 | $40,000 | $139,020 |
| 2014 | -- | $170,810 | $40,000 | $130,810 |
| 2013 | -- | $170,810 | $40,000 | $130,810 |
Source: Public Records
Map
Nearby Homes
- 5007 S Desert Dove Loop
- 5002 Spirea Dr
- 5200 S Desert Dove Loop
- 5258 Chris St
- 3000 S Highlands Blvd
- 4728 Forsythia St
- 3538 Curtis Dr
- 5507 Monica St
- 5600 Kirkwood Ln
- 4721 Holly Way
- 5506 Aspen Dr
- 5103 Crane Dr
- 3909 Curtis Dr
- 6363 Keene Rd
- 6397 Keene Rd
- 6461 Keene Rd
- 5705 Aspen Dr
- 2730 Westhaven Ct
- 1120 Keene Rd
- 2512 Hickory Ave
- 5011 S Desert Dove Loop
- 3221 Kristin Ct
- 3225 Kristin Ct
- 5101 Desert Dove Dr
- 5110 Canter St
- 5010 S Desert Dove Loop
- 5101 S Desert Dove Loop
- 5005 S Desert Dove Loop
- 5003 S Desert Dove Loop
- 3220 Kristin Ct
- 3211 Kristin Ct
- 5000 S Desert Dove Loop
- 5100 S Desert Dove Loop
- 5100 Canter St
- 5103 S Desert Dove Loop
- 5001 Spirea Dr
- 5005 Spirea Dr
- 3210 Kristin Ct
- 5010 Canter St
- 5120 Canter St