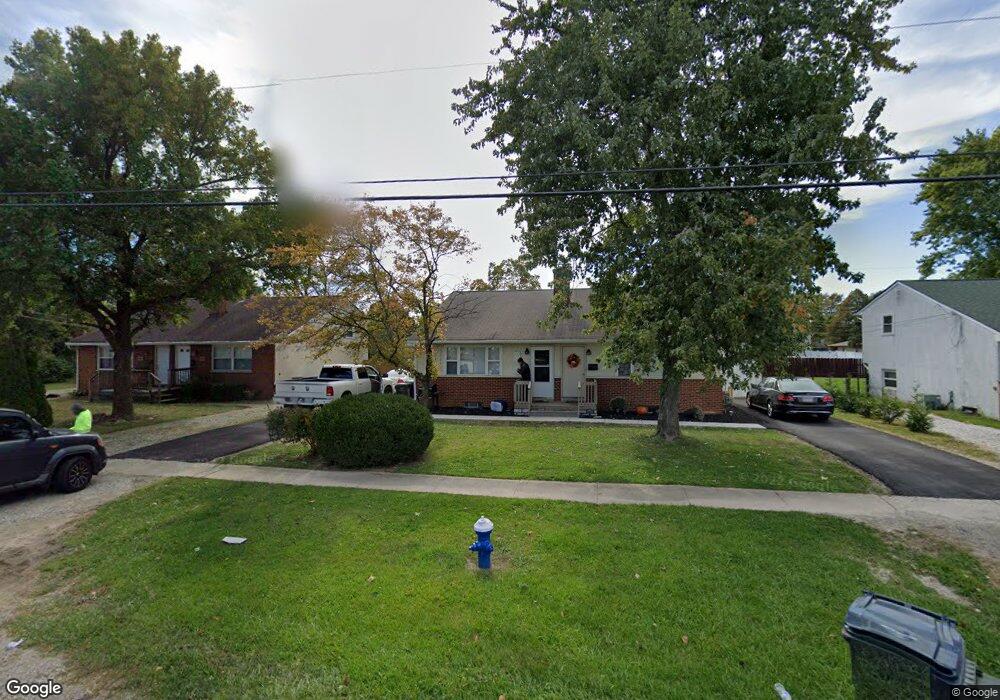
5009 Scioto Darby Rd Unit 11 Hilliard, OH 43026
Estimated Value: $249,000 - $416,000
4
Beds
4
Baths
1,271
Sq Ft
$250/Sq Ft
Est. Value
About This Home
This home is located at 5009 Scioto Darby Rd Unit 11, Hilliard, OH 43026 and is currently estimated at $318,128, approximately $250 per square foot. 5009 Scioto Darby Rd Unit 11 is a home located in Franklin County with nearby schools including Scioto Darby Elementary School, Hilliard Station Sixth Grade Elementary School, and Hilliard Heritage Middle School.
Ownership History
Date
Name
Owned For
Owner Type
Purchase Details
Closed on
Oct 27, 2022
Sold by
Digiorgio Ross V and Digiorgio Patti M
Bought by
Ross V Digiorgio And The Patti M Digiorgio Jo and Digiorgio
Current Estimated Value
Purchase Details
Closed on
Oct 24, 2022
Sold by
Digiorgio Ross V and Digiorgio Patti M
Bought by
Ross V Digiorgio And The Patti M Digiorgio Jo
Purchase Details
Closed on
Sep 26, 2005
Sold by
Sweeney James Robert and The James Robert Sweeney Trust
Bought by
Digiorgio Ross V and Digiorgio Patti M
Home Financials for this Owner
Home Financials are based on the most recent Mortgage that was taken out on this home.
Original Mortgage
$131,000
Interest Rate
5.83%
Mortgage Type
Seller Take Back
Purchase Details
Closed on
Jun 23, 1992
Bought by
Sweeney James R Tr
Create a Home Valuation Report for This Property
The Home Valuation Report is an in-depth analysis detailing your home's value as well as a comparison with similar homes in the area
Home Values in the Area
Average Home Value in this Area
Purchase History
| Date | Buyer | Sale Price | Title Company |
|---|---|---|---|
| Ross V Digiorgio And The Patti M Digiorgio Jo | -- | None Listed On Document | |
| Ross V Digiorgio And The Patti M Digiorgio Jo | -- | -- | |
| Digiorgio Ross V | $130,000 | -- | |
| Sweeney James R Tr | -- | -- |
Source: Public Records
Mortgage History
| Date | Status | Borrower | Loan Amount |
|---|---|---|---|
| Previous Owner | Digiorgio Ross V | $131,000 |
Source: Public Records
Tax History Compared to Growth
Tax History
| Year | Tax Paid | Tax Assessment Tax Assessment Total Assessment is a certain percentage of the fair market value that is determined by local assessors to be the total taxable value of land and additions on the property. | Land | Improvement |
|---|---|---|---|---|
| 2024 | $5,781 | $84,570 | $23,000 | $61,570 |
| 2023 | $4,730 | $84,560 | $22,995 | $61,565 |
| 2022 | $4,075 | $57,960 | $16,170 | $41,790 |
| 2021 | $4,072 | $57,960 | $16,170 | $41,790 |
| 2020 | $4,063 | $57,960 | $16,170 | $41,790 |
| 2019 | $3,820 | $46,380 | $12,950 | $33,430 |
| 2018 | $3,571 | $46,380 | $12,950 | $33,430 |
| 2017 | $3,808 | $46,380 | $12,950 | $33,430 |
| 2016 | $3,524 | $39,730 | $12,080 | $27,650 |
| 2015 | $3,334 | $39,730 | $12,080 | $27,650 |
| 2014 | $3,340 | $39,730 | $12,080 | $27,650 |
| 2013 | $1,794 | $39,725 | $12,075 | $27,650 |
Source: Public Records
Map
Nearby Homes
- 5126 Bigelow Dr
- 5190 Bigelow Dr
- 4933 Travers Ct
- 3255 Reed Point Dr
- 4967 Carroll Ct
- 3661 Patty Ln
- 5251 Bigelow Dr
- 5222 Bonner Dr
- 5175 Wyandot Place
- 5293 Williamsburg Cir
- 5220 Conklin Dr
- 5062 Stoneybrook Blvd Unit 3F
- 5080 Stoneybrook Blvd Unit 2D
- 5078 Stoneybrook Blvd Unit 2E
- 5137 Drivemere Rd
- 3643 Carriage Run Dr
- 5053 Stoneybrook Blvd
- 5041 Stoneybrook Blvd Unit 9E
- 5155 Drivemere Rd
- 5258 Scioto Darby Rd
- 5021 Scioto Darby Rd
- 5019 Scioto Darby Rd Unit 21
- 4997-4999 Scioto Darby Rd
- 4997 Scioto Darby Rd Unit 999
- 5030 Mengel Ln
- 5027 Scioto Darby Rd Unit 29
- 5038 Mengel Ln
- 5024 Mengel Ln
- 5044 Mengel Ln
- 5031 Scioto Darby Rd Unit 33
- 5018 Mengel Ln
- 5052 Mengel Ln
- 5035 Scioto Darby Rd Unit 37
- 5066 Mengel Ln
- 5036 Scioto Darby Rd
- 5038 Bigelow Dr
- 5043 Bigelow Dr
- 5053 Mengel Ln
- 3516 Jill Ln
- 5074 Mengel Ln