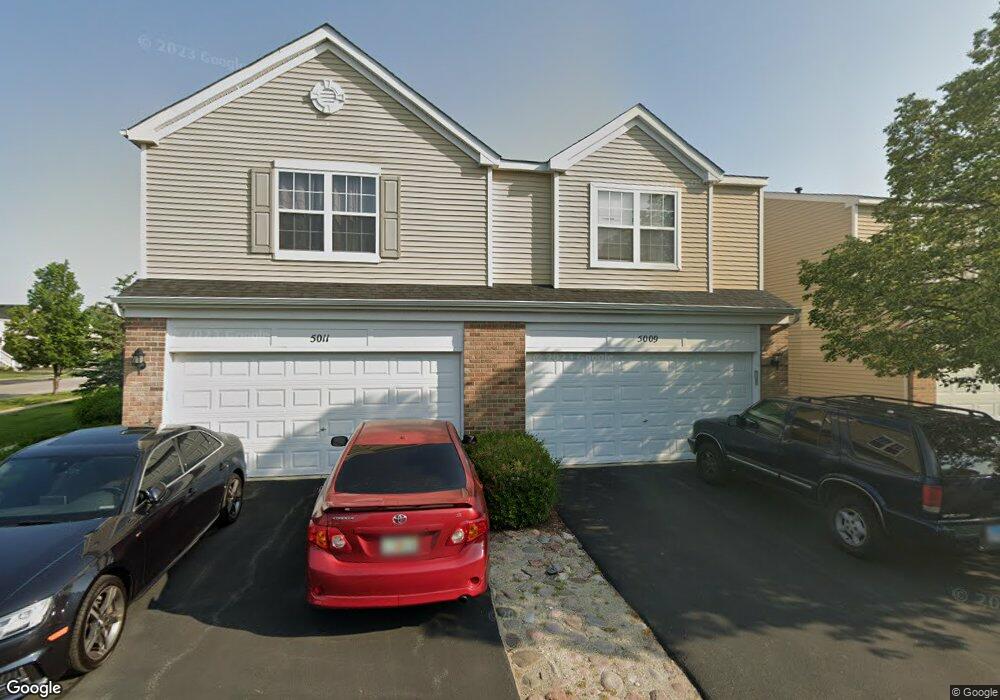
5009 Syracuse Ct Unit NONE Plainfield, IL 60586
Fall Creek NeighborhoodEstimated Value: $261,000 - $270,583
Studio
2
Baths
1,484
Sq Ft
$179/Sq Ft
Est. Value
About This Home
This home is located at 5009 Syracuse Ct Unit NONE, Plainfield, IL 60586 and is currently estimated at $265,146, approximately $178 per square foot. 5009 Syracuse Ct Unit NONE is a home located in Will County with nearby schools including Hofer Elementary School, Troy Middle School, and Orenic Intermediate School.
Ownership History
Date
Name
Owned For
Owner Type
Purchase Details
Closed on
Sep 14, 2018
Sold by
Chen Hui
Bought by
Telar Llc
Current Estimated Value
Purchase Details
Closed on
Dec 16, 2016
Sold by
Secretary Of Housing & Urban Development
Bought by
Che Hui
Purchase Details
Closed on
Jun 24, 2016
Sold by
Ocwen Loan Servicing Llc
Bought by
The Secretary Of Housing & Urban Develop
Purchase Details
Closed on
May 19, 2016
Sold by
Ebersole Phillip A and Case #15 Ch 00156
Bought by
Ocwen Loan Servicing Llc
Purchase Details
Closed on
Nov 3, 2003
Sold by
Centex Homes
Bought by
Ebersole Philip A
Home Financials for this Owner
Home Financials are based on the most recent Mortgage that was taken out on this home.
Original Mortgage
$143,900
Interest Rate
5.88%
Mortgage Type
FHA
Create a Home Valuation Report for This Property
The Home Valuation Report is an in-depth analysis detailing your home's value as well as a comparison with similar homes in the area
Home Values in the Area
Average Home Value in this Area
Purchase History
| Date | Buyer | Sale Price | Title Company |
|---|---|---|---|
| Telar Llc | -- | Attorney | |
| Che Hui | $120,900 | First American Title Ins Co | |
| The Secretary Of Housing & Urban Develop | -- | Servicelink | |
| Ocwen Loan Servicing Llc | -- | Attorney | |
| Ebersole Philip A | $148,500 | Chicago Title Insurance Co |
Source: Public Records
Mortgage History
| Date | Status | Borrower | Loan Amount |
|---|---|---|---|
| Previous Owner | Ebersole Philip A | $143,900 |
Source: Public Records
Tax History
| Year | Tax Paid | Tax Assessment Tax Assessment Total Assessment is a certain percentage of the fair market value that is determined by local assessors to be the total taxable value of land and additions on the property. | Land | Improvement |
|---|---|---|---|---|
| 2024 | $7,153 | $81,477 | $12,644 | $68,833 |
| 2023 | $7,153 | $73,205 | $11,360 | $61,845 |
| 2022 | $5,476 | $58,998 | $10,749 | $48,249 |
| 2021 | $5,157 | $55,501 | $10,112 | $45,389 |
| 2020 | $4,986 | $53,584 | $10,112 | $43,472 |
| 2019 | $4,852 | $51,400 | $9,700 | $41,700 |
| 2018 | $4,703 | $48,350 | $9,700 | $38,650 |
| 2017 | $4,471 | $45,086 | $9,700 | $35,386 |
| 2016 | $3,782 | $42,775 | $9,700 | $33,075 |
| 2015 | $3,491 | $39,623 | $8,123 | $31,500 |
| 2014 | $3,491 | $39,033 | $8,123 | $30,910 |
| 2013 | $3,491 | $41,088 | $8,123 | $32,965 |
Source: Public Records
Map
Nearby Homes
- 5116 New Haven Ct Unit 4
- 1409 Bridgehampton Dr
- 1303 Bridgehampton Dr Unit 2
- 1700 Chestnut Hill Rd
- 5214 Riviera Blvd
- 1707 Chestnut Hill Rd
- 5210 Pine Trails Cir
- 1107 Shorewood Dr Unit 3
- 1504 Lasser Dr
- 818 Vertin Blvd
- 5411 Maha Ct
- 4513 Skylark Ln
- 1114 Kylemore Ct
- 4511 Skylark Ln
- 4714 Mikasa Ct
- 1909 Prairie Trail Ct
- 4612 Edinburgh Ct Unit 2
- 1109 Kerry Ln
- 4757 Foster Ct Unit 3
- 2010 Primrose Dr
- 5005 Syracuse Ct Unit 4
- 5009 Syracuse Ct Unit 2
- 5001 Syracuse Ct Unit 6
- 5003 Syracuse Ct Unit 5
- 5007 Syracuse Ct Unit 3
- 5007 Syracuse Ct Unit 5007
- 5011 Syracuse Ct
- 5011 Syracuse Ct Unit 5011
- 5010 Norwalk Ct Unit 1
- 5014 Norwalk Ct Unit 3
- 5012 Norwalk Ct Unit 2
- 5016 Norwalk Ct Unit 4
- 5002 Syracuse Ct Unit 1
- 5006 Syracuse Ct Unit 3
- 5008 Syracuse Ct Unit 4
- 5004 Syracuse Ct Unit 2
- 5008 Syracuse Ct Unit 5008
- 5004 Syracuse Ct Unit 5004
- 5005 Norwalk Ct Unit 2
- 5007 Norwalk Ct Unit 1
Your Personal Tour Guide
Ask me questions while you tour the home.