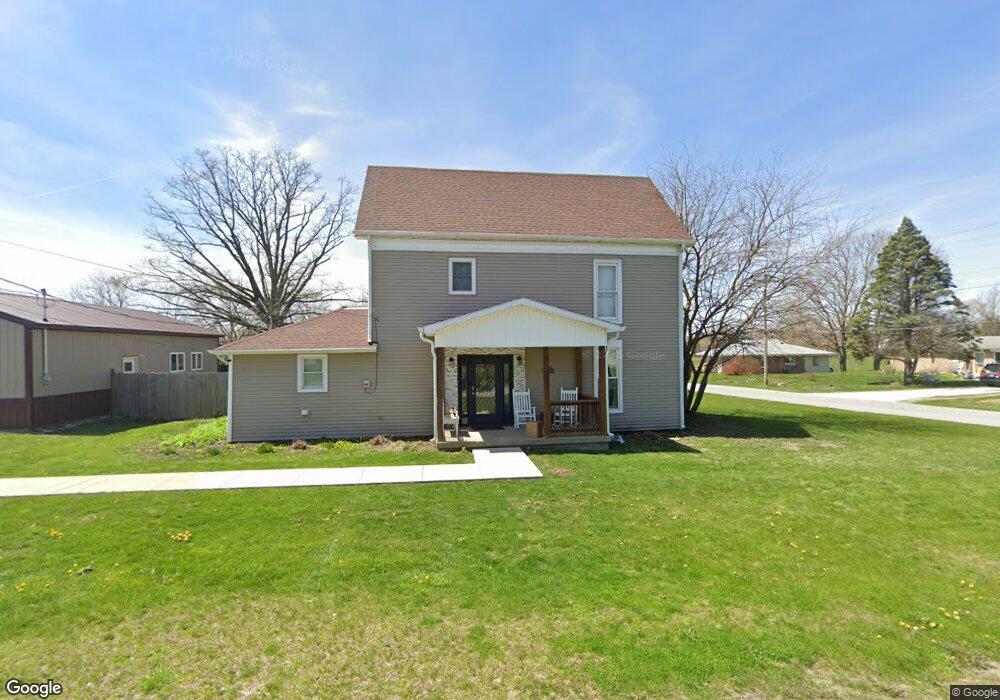
501 4th St Frankton, IN 46044
Estimated Value: $169,000 - $328,000
4
Beds
2
Baths
1,780
Sq Ft
$130/Sq Ft
Est. Value
About This Home
This home is located at 501 4th St, Frankton, IN 46044 and is currently estimated at $231,636, approximately $130 per square foot. 501 4th St is a home located in Madison County with nearby schools including Frankton Elementary School and Frankton Junior/Senior High School.
Ownership History
Date
Name
Owned For
Owner Type
Purchase Details
Closed on
Apr 5, 2021
Sold by
Pullen Realty Llc
Bought by
Adams Kayla M and Kinser Zachary M
Current Estimated Value
Home Financials for this Owner
Home Financials are based on the most recent Mortgage that was taken out on this home.
Original Mortgage
$201,286
Outstanding Balance
$180,644
Interest Rate
2.9%
Mortgage Type
FHA
Estimated Equity
$50,992
Purchase Details
Closed on
Dec 20, 2018
Sold by
Wells Fargo Bank
Bought by
Pullen Realty Llc
Purchase Details
Closed on
Nov 16, 2018
Sold by
Madison County Sheriff
Bought by
Wells Fargo Bank
Purchase Details
Closed on
Jul 13, 2010
Sold by
Heath Jared D and Heath Kimberly R
Bought by
Wheeler Brandon T
Home Financials for this Owner
Home Financials are based on the most recent Mortgage that was taken out on this home.
Original Mortgage
$731,016
Interest Rate
4.74%
Mortgage Type
FHA
Create a Home Valuation Report for This Property
The Home Valuation Report is an in-depth analysis detailing your home's value as well as a comparison with similar homes in the area
Home Values in the Area
Average Home Value in this Area
Purchase History
| Date | Buyer | Sale Price | Title Company |
|---|---|---|---|
| Adams Kayla M | $205,000 | None Available | |
| Pullen Realty Llc | $26,500 | Boston National Title | |
| Wells Fargo Bank | $29,250 | None Available | |
| Wheeler Brandon T | -- | -- |
Source: Public Records
Mortgage History
| Date | Status | Borrower | Loan Amount |
|---|---|---|---|
| Open | Adams Kayla M | $201,286 | |
| Previous Owner | Wheeler Brandon T | $731,016 |
Source: Public Records
Tax History
| Year | Tax Paid | Tax Assessment Tax Assessment Total Assessment is a certain percentage of the fair market value that is determined by local assessors to be the total taxable value of land and additions on the property. | Land | Improvement |
|---|---|---|---|---|
| 2025 | $1,580 | $165,400 | $16,900 | $148,500 |
| 2024 | $1,580 | $158,000 | $16,900 | $141,100 |
| 2023 | $1,451 | $145,100 | $16,100 | $129,000 |
| 2022 | $1,454 | $145,400 | $15,000 | $130,400 |
| 2021 | $605 | $75,600 | $15,000 | $60,600 |
| 2020 | $1,458 | $72,900 | $15,000 | $57,900 |
| 2019 | $1,320 | $66,000 | $15,000 | $51,000 |
| 2018 | $459 | $61,000 | $15,000 | $46,000 |
| 2017 | $409 | $60,900 | $15,000 | $45,900 |
| 2016 | $523 | $73,700 | $15,000 | $58,700 |
| 2014 | $506 | $73,200 | $15,000 | $58,200 |
| 2013 | $506 | $73,200 | $15,000 | $58,200 |
Source: Public Records
Map
Nearby Homes
- 309 W Clyde St
- 501 S 4th St
- 308 W Clyde St
- 508 4th St
- Lot 116,117,118 W Clyde St
- Lot 132,133,134 W Clyde St
- Lot 121,122,123 W Clyde St
- Lots 121, 122, 123 W Clyde St
- Lots 119, 120 W Clyde St
- Lots 116, 117, 118 W Clyde St
- Lots 146, 147 W Clyde St
- Lots 144, 145 W Clyde St
- Lots 142, 143 W Clyde St
- Lots 132, 133, 134 W Clyde St
- Lots 130, 131 W Clyde St
- Lots 133, 134 W Clyde St
- Lots 128, 129 W Clyde St
- Lots 126, 127 W Clyde St
- Lots 124, 125 W Clyde St
- Lots 121-123 W Clyde St
Your Personal Tour Guide
Ask me questions while you tour the home.