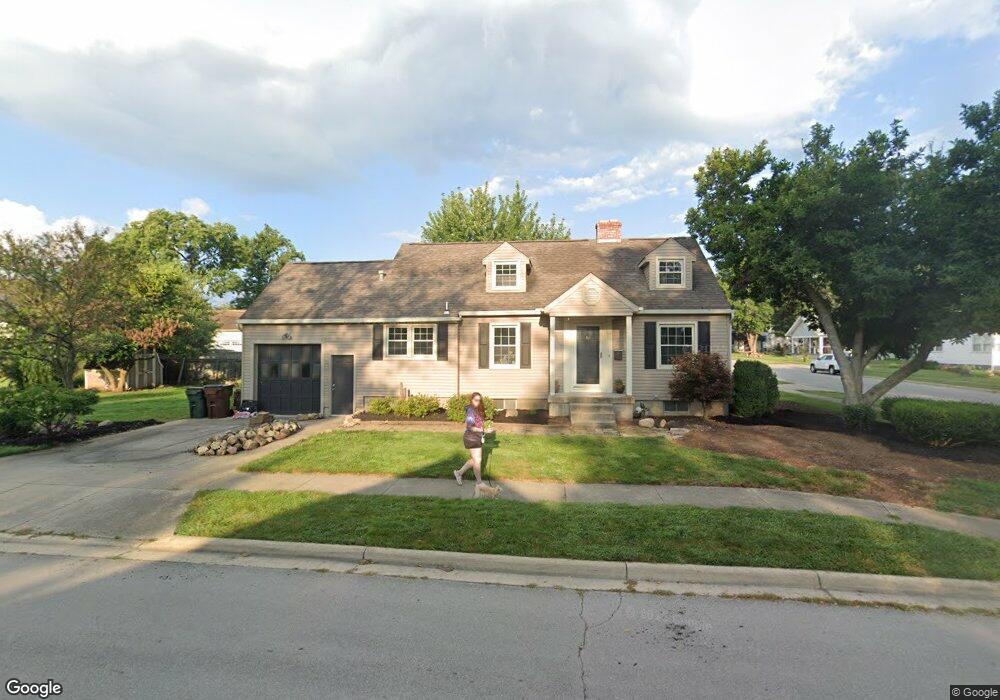
501 Albert St Englewood, OH 45322
Estimated Value: $164,000 - $199,000
3
Beds
1
Bath
1,397
Sq Ft
$131/Sq Ft
Est. Value
About This Home
This home is located at 501 Albert St, Englewood, OH 45322 and is currently estimated at $182,877, approximately $130 per square foot. 501 Albert St is a home located in Montgomery County with nearby schools including Northmont High School, Trotwood Preparatory & Fitness Academy, and Imagine Schools - Woodbury Academy.
Ownership History
Date
Name
Owned For
Owner Type
Purchase Details
Closed on
Jan 3, 2023
Sold by
Collins Timothy J and Collins Megan R
Bought by
Stanforth Renovations Llc
Current Estimated Value
Purchase Details
Closed on
Nov 29, 2004
Sold by
Vargo Judith A
Bought by
Alexander Joseph Scott and Alexander Stacy L
Home Financials for this Owner
Home Financials are based on the most recent Mortgage that was taken out on this home.
Original Mortgage
$102,900
Interest Rate
5.82%
Mortgage Type
Fannie Mae Freddie Mac
Purchase Details
Closed on
Jun 14, 1995
Sold by
Pumphrey Timothy S and Pumphrey Cynthia Marie
Bought by
Vargo Judith A
Purchase Details
Closed on
May 3, 1994
Sold by
Pumphrey Cynthia Marie and Morter Cynthia Marie
Bought by
Pumphrey Timothy S and Pumphrey Cynthia Marie
Create a Home Valuation Report for This Property
The Home Valuation Report is an in-depth analysis detailing your home's value as well as a comparison with similar homes in the area
Home Values in the Area
Average Home Value in this Area
Purchase History
| Date | Buyer | Sale Price | Title Company |
|---|---|---|---|
| Stanforth Renovations Llc | $110,500 | None Listed On Document | |
| Alexander Joseph Scott | $102,900 | None Available | |
| Vargo Judith A | -- | Landmark Title | |
| Pumphrey Timothy S | -- | -- |
Source: Public Records
Mortgage History
| Date | Status | Borrower | Loan Amount |
|---|---|---|---|
| Previous Owner | Alexander Joseph Scott | $102,900 |
Source: Public Records
Tax History Compared to Growth
Tax History
| Year | Tax Paid | Tax Assessment Tax Assessment Total Assessment is a certain percentage of the fair market value that is determined by local assessors to be the total taxable value of land and additions on the property. | Land | Improvement |
|---|---|---|---|---|
| 2024 | $2,596 | $45,110 | $8,720 | $36,390 |
| 2023 | $2,596 | $45,110 | $8,720 | $36,390 |
| 2022 | $2,499 | $33,660 | $6,510 | $27,150 |
| 2021 | $2,506 | $33,660 | $6,510 | $27,150 |
| 2020 | $2,535 | $33,660 | $6,510 | $27,150 |
| 2019 | $2,071 | $25,360 | $6,200 | $19,160 |
| 2018 | $2,033 | $25,360 | $6,200 | $19,160 |
| 2017 | $2,019 | $25,360 | $6,200 | $19,160 |
| 2016 | $1,995 | $24,620 | $6,200 | $18,420 |
| 2015 | $1,825 | $24,620 | $6,200 | $18,420 |
| 2014 | $1,825 | $24,620 | $6,200 | $18,420 |
| 2012 | -- | $27,670 | $6,270 | $21,400 |
Source: Public Records
Map
Nearby Homes
- 108 Tate Ave
- 607 Albert St
- 208 S Walnut St
- 109 Silverstone Dr
- 104 Silverstone Dr
- 123 Chestnut St
- 206 Lodestone Dr
- 803 Albert St
- 800 Sipos Cir
- 510 Rohr Ln
- 118 Elm Ct
- 534 Unger Ave
- 717 Woodlawn Ave
- 320 Camborne Dr
- 718 Bonnycastle Ave
- 510 Lambert Ln
- 332 Beckenham Rd
- 408 W Herr St
- 108 Denwood Trail
- 322 Rankin Dr