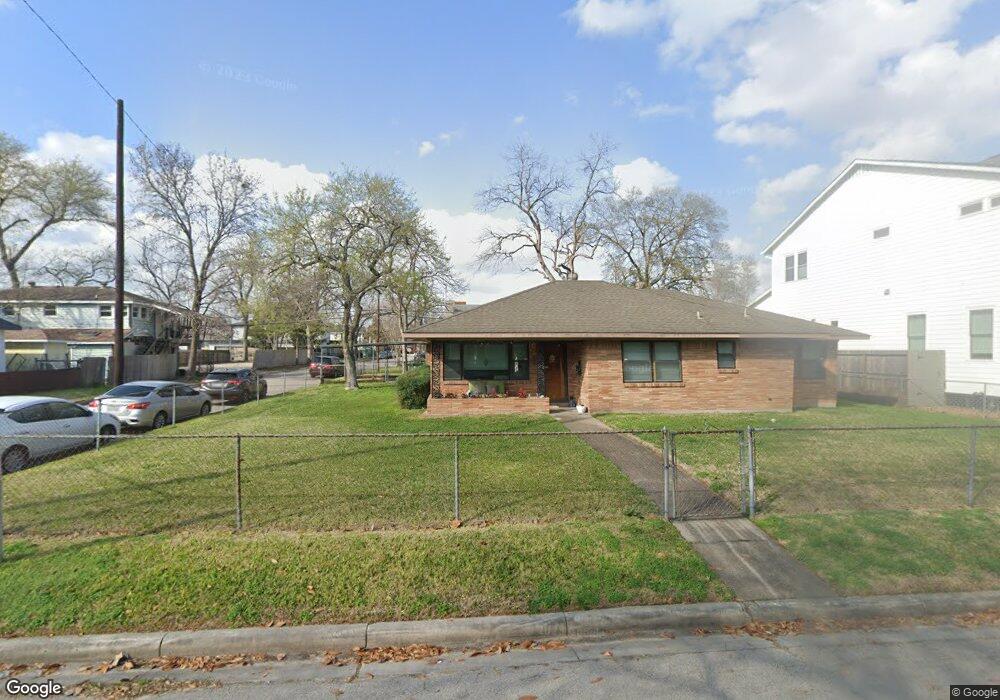
501 Aurora St Houston, TX 77008
Greater Heights NeighborhoodEstimated Value: $652,000 - $762,000
3
Beds
2
Baths
1,619
Sq Ft
$427/Sq Ft
Est. Value
About This Home
This home is located at 501 Aurora St, Houston, TX 77008 and is currently estimated at $691,378, approximately $427 per square foot. 501 Aurora St is a home located in Harris County with nearby schools including Field Elementary School, Hamilton Middle, and Heights High School.
Ownership History
Date
Name
Owned For
Owner Type
Purchase Details
Closed on
Feb 25, 1999
Sold by
Houston Housing Finance Corp
Bought by
Jenkins Ronald E and Jenkins Patricia A
Current Estimated Value
Purchase Details
Closed on
Dec 18, 1998
Sold by
Furstenberg Cecil Blaffer Von and Furstenberg Cecil Blaffer
Bought by
Hudson Brothers Real Estate Ltd Prtnrshp
Purchase Details
Closed on
Nov 22, 1995
Sold by
Budzisz Willie Martha
Bought by
Meschwitz Elizabeth Anne
Create a Home Valuation Report for This Property
The Home Valuation Report is an in-depth analysis detailing your home's value as well as a comparison with similar homes in the area
Home Values in the Area
Average Home Value in this Area
Purchase History
| Date | Buyer | Sale Price | Title Company |
|---|---|---|---|
| Jenkins Ronald E | -- | -- | |
| Hudson Brothers Real Estate Ltd Prtnrshp | -- | -- | |
| Meschwitz Elizabeth Anne | -- | Fidelity National Title |
Source: Public Records
Tax History Compared to Growth
Tax History
| Year | Tax Paid | Tax Assessment Tax Assessment Total Assessment is a certain percentage of the fair market value that is determined by local assessors to be the total taxable value of land and additions on the property. | Land | Improvement |
|---|---|---|---|---|
| 2025 | $2,457 | $730,000 | $711,645 | $18,355 |
| 2024 | $2,457 | $683,355 | $675,000 | $8,355 |
| 2023 | $2,065 | $699,106 | $630,000 | $69,106 |
| 2022 | $10,903 | $608,423 | $522,000 | $86,423 |
| 2021 | $10,492 | $558,626 | $495,000 | $63,626 |
| 2020 | $9,910 | $507,000 | $495,000 | $12,000 |
| 2019 | $9,414 | $520,000 | $495,000 | $25,000 |
| 2018 | $1,612 | $473,000 | $468,000 | $5,000 |
| 2017 | $7,774 | $473,000 | $468,000 | $5,000 |
| 2016 | $7,068 | $445,000 | $390,000 | $55,000 |
| 2015 | $1,139 | $409,606 | $337,500 | $72,106 |
| 2014 | $1,139 | $337,893 | $270,000 | $67,893 |
Source: Public Records
Map
Nearby Homes