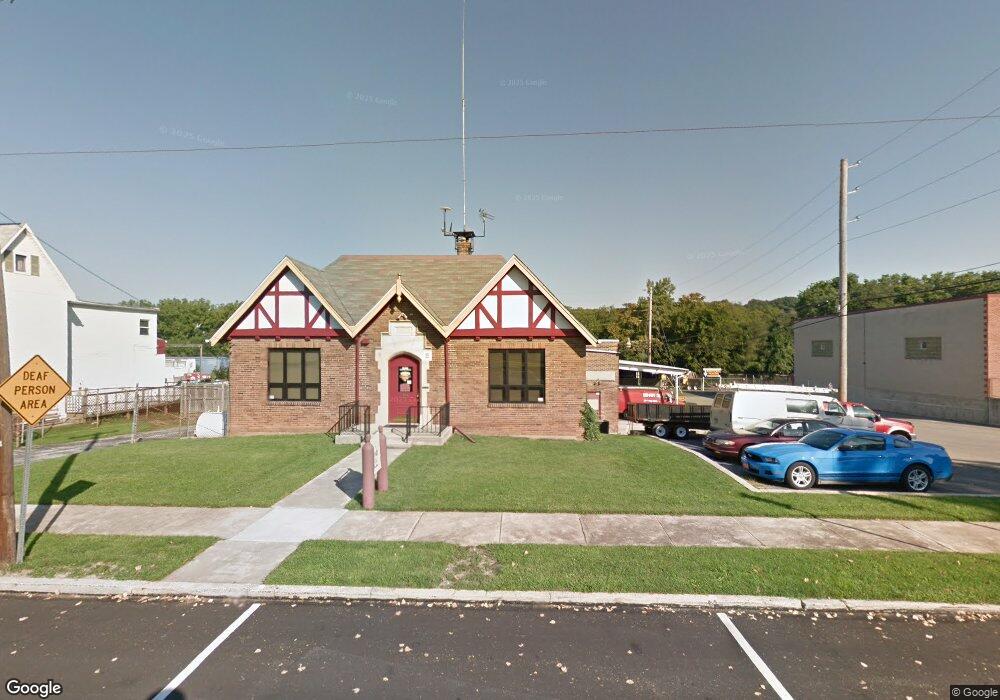
501 Bosler Ave Lemoyne, PA 17043
Estimated Value: $555,672
--
Bed
--
Bath
7,730
Sq Ft
$72/Sq Ft
Est. Value
About This Home
This home is located at 501 Bosler Ave, Lemoyne, PA 17043 and is currently estimated at $555,672, approximately $71 per square foot. 501 Bosler Ave is a home located in Cumberland County with nearby schools including Washington Heights Elementary School, New Cumberland Middle School, and Page County Middle School.
Ownership History
Date
Name
Owned For
Owner Type
Purchase Details
Closed on
Dec 3, 2020
Sold by
Magee Andrea M and Behne Steven J
Bought by
Md Real Estate Investments Llc
Current Estimated Value
Home Financials for this Owner
Home Financials are based on the most recent Mortgage that was taken out on this home.
Original Mortgage
$320,000
Outstanding Balance
$285,403
Interest Rate
2.8%
Mortgage Type
New Conventional
Estimated Equity
$270,269
Purchase Details
Closed on
Sep 27, 1999
Sold by
Shane A Mrakovi Ch
Bought by
Behney Steven J
Create a Home Valuation Report for This Property
The Home Valuation Report is an in-depth analysis detailing your home's value as well as a comparison with similar homes in the area
Home Values in the Area
Average Home Value in this Area
Purchase History
| Date | Buyer | Sale Price | Title Company |
|---|---|---|---|
| Md Real Estate Investments Llc | $400,000 | None Available | |
| Behney Steven J | $172,500 | -- |
Source: Public Records
Mortgage History
| Date | Status | Borrower | Loan Amount |
|---|---|---|---|
| Open | Md Real Estate Investments Llc | $320,000 |
Source: Public Records
Tax History Compared to Growth
Tax History
| Year | Tax Paid | Tax Assessment Tax Assessment Total Assessment is a certain percentage of the fair market value that is determined by local assessors to be the total taxable value of land and additions on the property. | Land | Improvement |
|---|---|---|---|---|
| 2025 | $4,207 | $200,200 | $89,300 | $110,900 |
| 2024 | $4,020 | $200,200 | $89,300 | $110,900 |
| 2023 | $3,733 | $200,200 | $89,300 | $110,900 |
| 2022 | $3,652 | $200,200 | $89,300 | $110,900 |
| 2021 | $3,566 | $200,200 | $89,300 | $110,900 |
| 2020 | $3,491 | $200,200 | $89,300 | $110,900 |
| 2019 | $3,431 | $200,200 | $89,300 | $110,900 |
| 2018 | $3,342 | $200,200 | $89,300 | $110,900 |
| 2017 | $3,163 | $200,200 | $89,300 | $110,900 |
| 2016 | -- | $200,200 | $89,300 | $110,900 |
| 2015 | -- | $200,200 | $89,300 | $110,900 |
| 2014 | -- | $200,200 | $89,300 | $110,900 |
Source: Public Records
Map
Nearby Homes