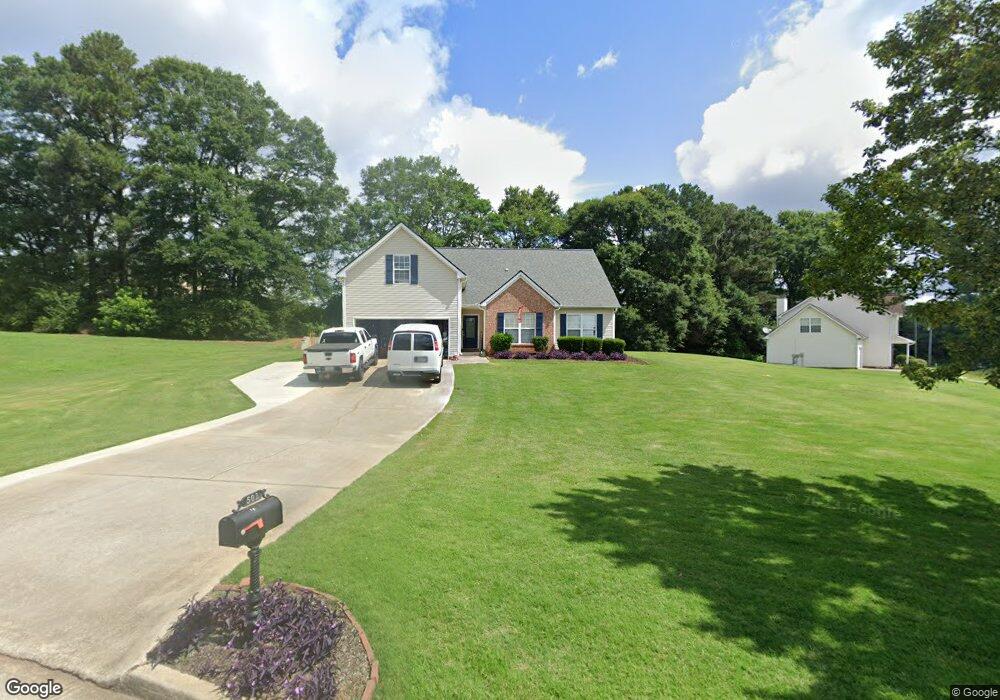
501 Chelsey Ct Winder, GA 30680
Estimated Value: $282,000 - $346,000
--
Bed
2
Baths
1,842
Sq Ft
$174/Sq Ft
Est. Value
About This Home
This home is located at 501 Chelsey Ct, Winder, GA 30680 and is currently estimated at $320,580, approximately $174 per square foot. 501 Chelsey Ct is a home located in Barrow County with nearby schools including Bethlehem Elementary School, Haymon-Morris Middle School, and Apalachee High School.
Ownership History
Date
Name
Owned For
Owner Type
Purchase Details
Closed on
Mar 29, 2019
Sold by
Davis Billy
Bought by
Doman Josh James and Doman Reaggan Grace
Current Estimated Value
Home Financials for this Owner
Home Financials are based on the most recent Mortgage that was taken out on this home.
Original Mortgage
$126,100
Outstanding Balance
$110,864
Interest Rate
4.3%
Mortgage Type
New Conventional
Estimated Equity
$209,716
Purchase Details
Closed on
Nov 29, 2005
Sold by
Oakwood Builders Inc
Bought by
Davis Billy
Home Financials for this Owner
Home Financials are based on the most recent Mortgage that was taken out on this home.
Original Mortgage
$110,000
Interest Rate
8.5%
Mortgage Type
New Conventional
Purchase Details
Closed on
Aug 14, 2003
Sold by
Smith Mill Development Inc
Bought by
Oakwood Builders Inc
Purchase Details
Closed on
Aug 20, 2002
Bought by
Smith Mill Development Inc
Create a Home Valuation Report for This Property
The Home Valuation Report is an in-depth analysis detailing your home's value as well as a comparison with similar homes in the area
Home Values in the Area
Average Home Value in this Area
Purchase History
| Date | Buyer | Sale Price | Title Company |
|---|---|---|---|
| Doman Josh James | $130,000 | -- | |
| Davis Billy | $137,500 | -- | |
| Oakwood Builders Inc | $210,000 | -- | |
| Smith Mill Development Inc | -- | -- |
Source: Public Records
Mortgage History
| Date | Status | Borrower | Loan Amount |
|---|---|---|---|
| Open | Doman Josh James | $126,100 | |
| Previous Owner | Davis Billy | $110,000 |
Source: Public Records
Tax History Compared to Growth
Tax History
| Year | Tax Paid | Tax Assessment Tax Assessment Total Assessment is a certain percentage of the fair market value that is determined by local assessors to be the total taxable value of land and additions on the property. | Land | Improvement |
|---|---|---|---|---|
| 2024 | $2,122 | $83,207 | $16,000 | $67,207 |
| 2023 | $2,125 | $83,607 | $16,000 | $67,607 |
| 2022 | $1,778 | $59,457 | $16,000 | $43,457 |
| 2021 | $1,872 | $59,457 | $16,000 | $43,457 |
| 2020 | $1,649 | $59,457 | $16,000 | $43,457 |
| 2019 | $1,796 | $59,457 | $16,000 | $43,457 |
| 2018 | $1,647 | $55,457 | $12,000 | $43,457 |
| 2017 | $1,421 | $48,797 | $12,000 | $36,797 |
| 2016 | $1,326 | $45,864 | $12,000 | $33,864 |
| 2015 | $1,344 | $46,240 | $12,000 | $34,240 |
| 2014 | $1,216 | $41,672 | $7,056 | $34,616 |
| 2013 | -- | $39,976 | $7,056 | $32,920 |
Source: Public Records
Map
Nearby Homes
- 797 Ode Peppers Rd
- 633 Skyland Dr
- 865 Ode Peppers Ct
- 1224 Palmer Dr
- 259 Dunagan Ct
- 378 Dunagan Ct
- 1216 Austin Rd
- 1210 Austin Rd
- 1221 Casper Ln
- 1235 Dale Dr
- 868 Smith Mill Rd
- 856 Smith Mill Rd
- 0 Harrison Mill Rd Unit 10522698
- 0 Austin Rd Unit 7532172
- 0 Austin Rd Unit 10468005
- 0 Argonne Rd Unit 10602413
- 0 Argonne Rd Unit 7647986
- 898 Harrison Mill Rd
- 1101 Kailie Dr
- 503 Chelsey Ct
- 502 Chelsey Ct
- 1108 Kailie Dr
- 539 Smith Mill Rd
- 504 Chelsey Ct
- 504 Chelsey Ct Unit 7
- 507 Chelsey Ct
- 0 Smith Mill Unit 8357100
- 836 Smith Mill
- 850 Smith Mill
- 506 Chelsey Ct Unit 6A
- 506 Chelsey Ct
- 0 Chelsey Ct
- 509 Chelsey Ct
- 1110 Kailie Dr
- 546 Smith Mill Rd
- 1109 Kailie Dr
- 0 Kailie Dr Unit 7388815
- 0 Kailie Dr Unit 8420014