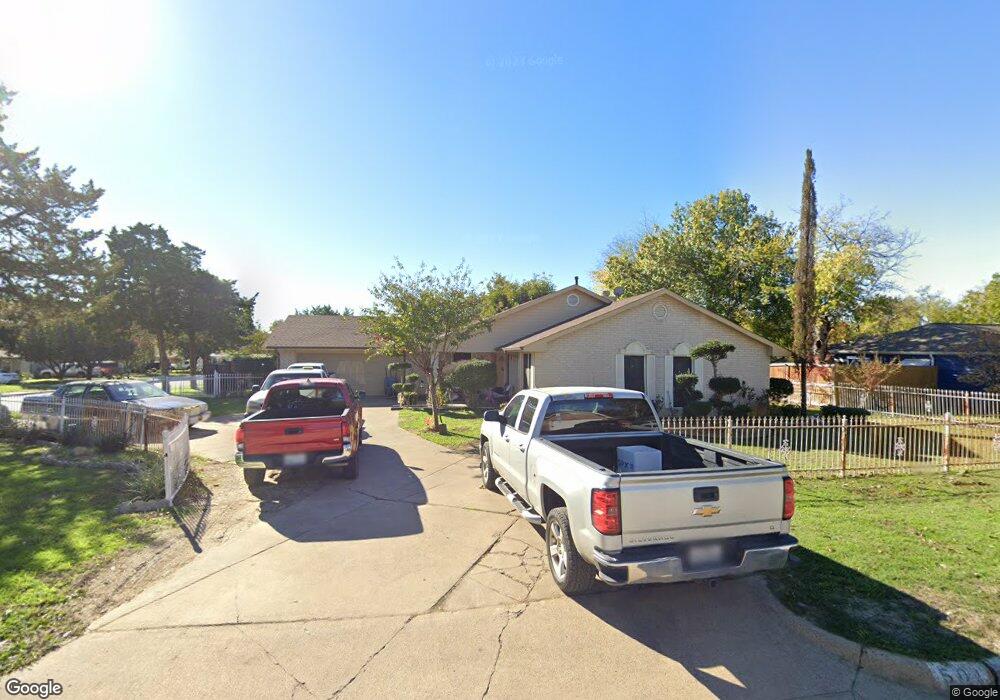
501 Chickapoo Trace Grand Prairie, TX 75051
Estimated Value: $241,000 - $268,000
3
Beds
3
Baths
1,388
Sq Ft
$184/Sq Ft
Est. Value
About This Home
This home is located at 501 Chickapoo Trace, Grand Prairie, TX 75051 and is currently estimated at $255,806, approximately $184 per square foot. 501 Chickapoo Trace is a home located in Dallas County with nearby schools including James Bowie Fine Arts Academy, Crosswinds High School, and Grand Prairie High School.
Ownership History
Date
Name
Owned For
Owner Type
Purchase Details
Closed on
Apr 21, 2015
Sold by
Preza Melchor Sedano and Preza Loreza V
Bought by
Preza Lorenza
Current Estimated Value
Purchase Details
Closed on
Aug 4, 2000
Sold by
Gp Homes Inc
Bought by
Preza Melchor Sedano and Preza Lorenza
Home Financials for this Owner
Home Financials are based on the most recent Mortgage that was taken out on this home.
Original Mortgage
$84,550
Outstanding Balance
$30,505
Interest Rate
8.15%
Estimated Equity
$225,301
Purchase Details
Closed on
Jun 28, 1994
Sold by
Rennels Robert E and Rennels Gloria I
Bought by
Blair Donna W
Home Financials for this Owner
Home Financials are based on the most recent Mortgage that was taken out on this home.
Original Mortgage
$37,000
Interest Rate
8.46%
Create a Home Valuation Report for This Property
The Home Valuation Report is an in-depth analysis detailing your home's value as well as a comparison with similar homes in the area
Purchase History
| Date | Buyer | Sale Price | Title Company |
|---|---|---|---|
| Preza Lorenza | -- | None Available | |
| Preza Melchor Sedano | -- | -- | |
| Blair Donna W | -- | -- |
Source: Public Records
Mortgage History
| Date | Status | Borrower | Loan Amount |
|---|---|---|---|
| Open | Preza Melchor Sedano | $84,550 | |
| Previous Owner | Blair Donna W | $37,000 |
Source: Public Records
Tax History
| Year | Tax Paid | Tax Assessment Tax Assessment Total Assessment is a certain percentage of the fair market value that is determined by local assessors to be the total taxable value of land and additions on the property. | Land | Improvement |
|---|---|---|---|---|
| 2025 | $2,892 | $194,710 | $49,500 | $145,210 |
| 2024 | $2,892 | $194,710 | $49,500 | $145,210 |
| 2023 | $2,892 | $210,790 | $49,500 | $161,290 |
| 2022 | $4,858 | $191,510 | $44,000 | $147,510 |
| 2021 | $4,595 | $172,880 | $38,500 | $134,380 |
| 2020 | $4,792 | $169,960 | $38,500 | $131,460 |
| 2019 | $4,186 | $143,280 | $30,800 | $112,480 |
| 2018 | $3,411 | $116,750 | $22,000 | $94,750 |
| 2017 | $3,214 | $110,080 | $22,000 | $88,080 |
| 2016 | $3,030 | $103,780 | $18,700 | $85,080 |
| 2015 | $2,247 | $97,940 | $18,700 | $79,240 |
| 2014 | $2,247 | $93,770 | $18,700 | $75,070 |
Source: Public Records
Map
Nearby Homes
- 617 Ouida St
- 405 SW 6th St
- 213 Alice Dr
- 209 Alice Dr
- 313 SW 6th St
- 709 SW Dallas St
- 825 Apache Trace
- 206 Matt Place
- 914 Tamara Ln
- 114 Motley St
- 29 SE 2nd St
- 832 Beechcraft Ave
- 1201 Bonham St, Bonham St
- 1218 W Church St
- 1129 W Church St
- 1325 W Church St
- 1133 W Church St
- 1013 SE 3rd St
- 406 Dawson Cir
- 1102 Fort Worth St
- 505 Chickapoo Trace
- 606 SW 5th St
- 610 SW 5th St
- 509 Chickapoo Trace
- 601 SW 5th St
- 609 SW 5th St
- 506 Chickapoo Trace
- 510 Chickapoo Trace
- 614 SW 5th St
- 613 SW 5th St
- 502 Chickapoo Trace
- 601 Chickapoo Trace
- 625 Cimarron Trace
- 621 Cimarron Trace
- 617 SW 5th St
- 514 Chickapoo Trace
- 618 SW 5th St
- 621 SW 5th St
- 513 SW 5th St
- 629 Cimarron Trace
Your Personal Tour Guide
Ask me questions while you tour the home.