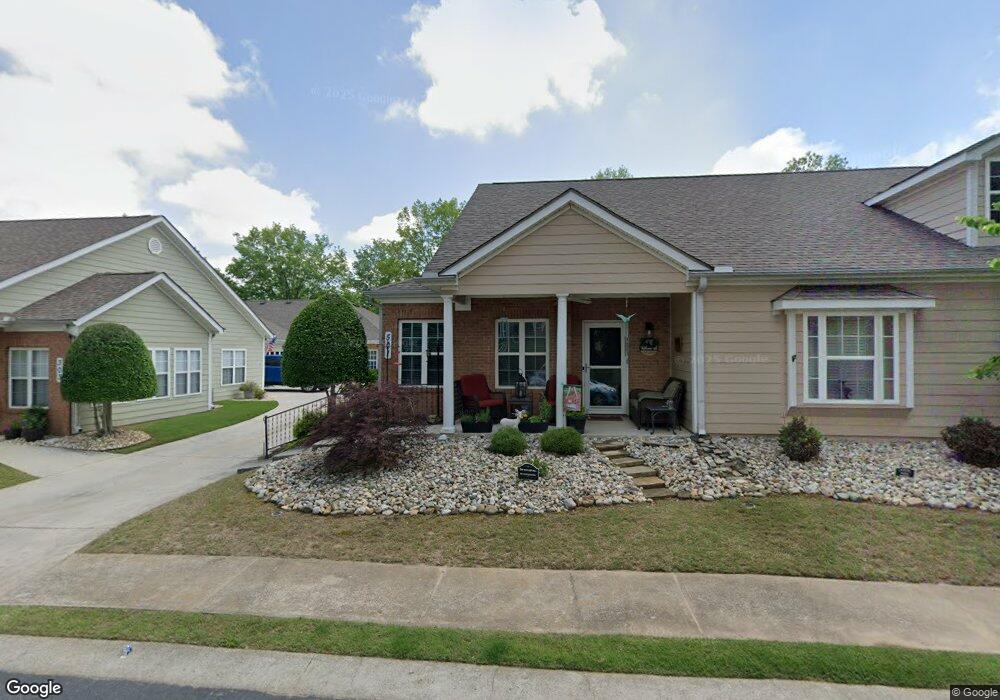
501 Commonwealth Cir Newnan, GA 30263
Estimated Value: $331,000 - $361,000
3
Beds
3
Baths
2,027
Sq Ft
$170/Sq Ft
Est. Value
About This Home
This home is located at 501 Commonwealth Cir, Newnan, GA 30263 and is currently estimated at $344,658, approximately $170 per square foot. 501 Commonwealth Cir is a home located in Coweta County with nearby schools including Jefferson Parkway Elementary School, Madras Middle School, and Northgate High School.
Ownership History
Date
Name
Owned For
Owner Type
Purchase Details
Closed on
Dec 21, 2021
Sold by
Danbury Charles W
Bought by
Danbury Charles W and Danbury Pamela J
Current Estimated Value
Purchase Details
Closed on
Jul 7, 2016
Sold by
Williamson Shirley M
Bought by
Danbury Charles W
Home Financials for this Owner
Home Financials are based on the most recent Mortgage that was taken out on this home.
Original Mortgage
$140,000
Interest Rate
3.6%
Mortgage Type
New Conventional
Purchase Details
Closed on
May 5, 2005
Sold by
Williamson Roger D
Bought by
Williamson Shirley M
Home Financials for this Owner
Home Financials are based on the most recent Mortgage that was taken out on this home.
Original Mortgage
$27,577
Interest Rate
5.88%
Mortgage Type
New Conventional
Purchase Details
Closed on
Mar 18, 2002
Sold by
Parkway Ventures Inc
Bought by
Calumet Builders Inc
Create a Home Valuation Report for This Property
The Home Valuation Report is an in-depth analysis detailing your home's value as well as a comparison with similar homes in the area
Home Values in the Area
Average Home Value in this Area
Purchase History
| Date | Buyer | Sale Price | Title Company |
|---|---|---|---|
| Danbury Charles W | -- | -- | |
| Danbury Charles W | $182,000 | -- | |
| Williamson Shirley M | -- | -- | |
| Calumet Builders Inc | $1,130,000 | -- |
Source: Public Records
Mortgage History
| Date | Status | Borrower | Loan Amount |
|---|---|---|---|
| Previous Owner | Danbury Charles W | $140,000 | |
| Previous Owner | Williamson Shirley M | $27,577 |
Source: Public Records
Tax History Compared to Growth
Tax History
| Year | Tax Paid | Tax Assessment Tax Assessment Total Assessment is a certain percentage of the fair market value that is determined by local assessors to be the total taxable value of land and additions on the property. | Land | Improvement |
|---|---|---|---|---|
| 2025 | $1,850 | $134,514 | $24,000 | $110,514 |
| 2024 | $1,985 | $129,387 | $24,000 | $105,387 |
| 2023 | $1,985 | $124,118 | $18,000 | $106,118 |
| 2022 | $1,552 | $105,408 | $14,000 | $91,408 |
| 2021 | $1,411 | $93,040 | $14,000 | $79,040 |
| 2020 | $1,454 | $93,040 | $14,000 | $79,040 |
| 2019 | $1,632 | $81,562 | $6,236 | $75,326 |
| 2018 | $2,351 | $81,562 | $6,236 | $75,326 |
| 2017 | $2,077 | $78,812 | $6,236 | $72,576 |
| 2016 | $1,183 | $78,812 | $6,236 | $72,576 |
| 2015 | $951 | $71,115 | $6,236 | $64,879 |
| 2014 | $1,205 | $63,967 | $6,236 | $57,731 |
Source: Public Records
Map
Nearby Homes
- 1502 Commonwealth Cir Unit 1502
- 4304 Commonwealth Cir Unit 4304
- 350 Brentwood Dr Unit 25
- 380 Brentwood Dr Unit 28
- 62 Seabiscuit Ct
- 63 Seabiscuit Ct
- 66 Seabiscuit Ct
- 67 Seabiscuit Ct
- 20 Claiborne Trail
- 9 Bluegrass Pass
- 12 Preakness Place
- 27 Churchill Park Dr
- 0 Bullsboro Dr Unit 22355306
- 30 Hawthorne Dr
- 10 Camellia Cir
- 6 Lynn Cir
- 23 Magnolia Dr
- 7 Red Bud Trail
- 35 Canyon View Dr
- 20 Bryce Creek Dr
- 503 Commonwealth Cir
- 502 Commonwealth Cir
- 303 Commonwealth Cir
- 504 Commonwealth Cir
- 304 Commonwealth Cir
- 603 Commonwealth Cir Unit 603
- 301 Commonwealth Cir
- 701 Commonwealth Cir Unit 701
- 302 Commonwealth Cir
- 702 Commonwealth Cir
- 403 Commonwealth Cir
- 703 Commonwealth Cir
- 704 Commonwealth Cir
- 604 Commonwealth Cir
- 401 Commonwealth Cir Unit 401
- 401 Commonwealth Cir
- 602 Commonwealth Cir
- 101 Commonwealth Cir
- 102 Commonwealth Cir Unit 102
- 404 Commonwealth Cir