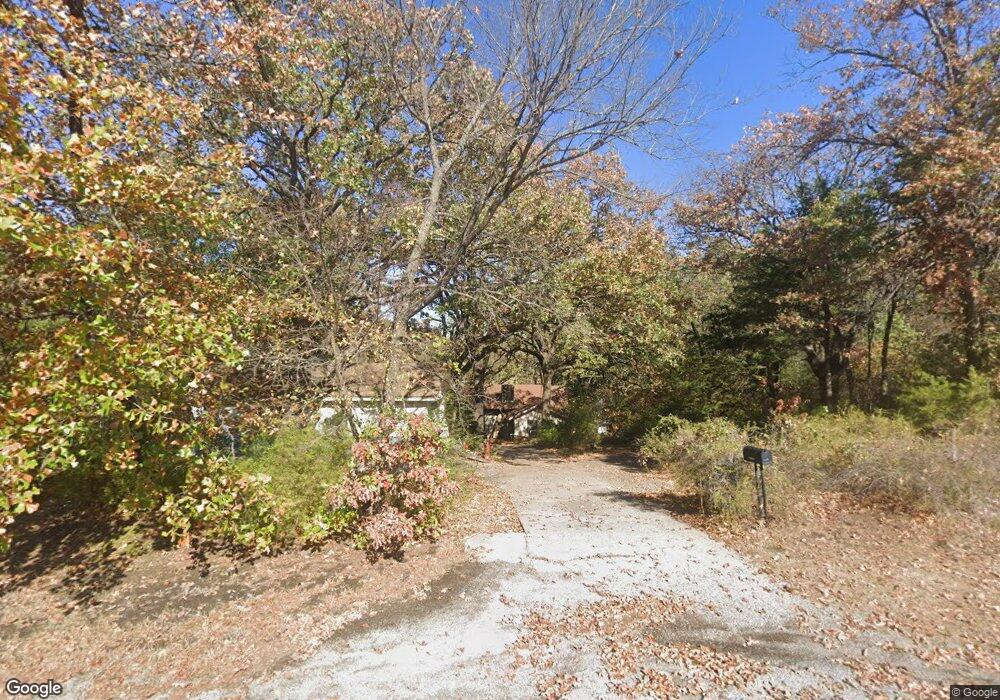
501 E 12th St Okmulgee, OK 74447
Estimated Value: $74,000 - $91,636
2
Beds
1
Bath
996
Sq Ft
$82/Sq Ft
Est. Value
About This Home
This home is located at 501 E 12th St, Okmulgee, OK 74447 and is currently estimated at $82,159, approximately $82 per square foot. 501 E 12th St is a home located in Okmulgee County with nearby schools including Okmulgee Primary School, Okmulgee Middle School, and Dunbar Elementary School.
Ownership History
Date
Name
Owned For
Owner Type
Purchase Details
Closed on
Sep 18, 2023
Sold by
Dale Billie and Dale Jim
Bought by
August 8 Investments Llc
Current Estimated Value
Home Financials for this Owner
Home Financials are based on the most recent Mortgage that was taken out on this home.
Original Mortgage
$600,000
Interest Rate
1.5%
Mortgage Type
Seller Take Back
Purchase Details
Closed on
Jun 1, 2023
Sold by
Deaton Olen C and Deaton Priscilla Sue
Bought by
Olen C And Priscilla Sue Deaton Joint Revocab
Purchase Details
Closed on
Nov 3, 2014
Sold by
Priscilla Deaton O and Priscilla Sue
Bought by
Jones Jimmy Dean and Jones Kathy D
Purchase Details
Closed on
Oct 5, 1999
Sold by
Manen David and Manen Rebecca
Bought by
Deaton Deaton O and Deaton Sue
Purchase Details
Closed on
Dec 29, 1995
Sold by
Deaton Deaton O and Deaton Priscilla
Bought by
Manen David and Manen Rebecca
Purchase Details
Closed on
Sep 29, 1995
Sold by
Linda Reich
Bought by
Deaton O C
Create a Home Valuation Report for This Property
The Home Valuation Report is an in-depth analysis detailing your home's value as well as a comparison with similar homes in the area
Home Values in the Area
Average Home Value in this Area
Purchase History
| Date | Buyer | Sale Price | Title Company |
|---|---|---|---|
| August 8 Investments Llc | $825,000 | Olt Real Estate Closing | |
| Olen C And Priscilla Sue Deaton Joint Revocab | -- | None Listed On Document | |
| Jones Jimmy Dean | -- | None Listed On Document | |
| Deaton Deaton O | $33,000 | -- | |
| Manen David | $33,000 | -- | |
| Deaton O C | $22,000 | -- |
Source: Public Records
Mortgage History
| Date | Status | Borrower | Loan Amount |
|---|---|---|---|
| Previous Owner | August 8 Investments Llc | $600,000 |
Source: Public Records
Tax History Compared to Growth
Tax History
| Year | Tax Paid | Tax Assessment Tax Assessment Total Assessment is a certain percentage of the fair market value that is determined by local assessors to be the total taxable value of land and additions on the property. | Land | Improvement |
|---|---|---|---|---|
| 2025 | $462 | $5,085 | $1,046 | $4,039 |
| 2024 | $462 | $5,103 | $1,046 | $4,057 |
| 2023 | $416 | $4,893 | $1,046 | $3,847 |
| 2022 | $414 | $4,893 | $1,046 | $3,847 |
| 2021 | $433 | $4,893 | $1,046 | $3,847 |
| 2020 | $433 | $4,893 | $1,046 | $3,847 |
| 2019 | $432 | $4,893 | $1,046 | $3,847 |
| 2018 | $421 | $4,702 | $1,005 | $3,697 |
| 2017 | $397 | $4,478 | $800 | $3,678 |
| 2016 | $379 | $4,265 | $979 | $3,286 |
| 2015 | $350 | $4,062 | $957 | $3,105 |
| 2014 | $335 | $3,869 | $912 | $2,957 |
Source: Public Records
Map
Nearby Homes
- 810 S Severs St
- 712 E 13th St
- 403 S Delaware Ave
- 806 E 13th St
- 820 S Wood Dr
- 322 S Porter Ave
- 600 E 7th St
- 416 S Grand Ave
- 706 S Chickasaw Ave
- 612 Muskogee
- 704 S Morton Ave
- 1225 S Delaware Ave
- 1029 S Sioux St
- 602 S Seminole Ave
- 311 E 5th St
- 4 E 13th St
- 708 S Miami Ave
- 1029 E 12th St
- 6 E Southbrook Ave
- 1123 E 9th St