Estimated Value: $693,000 - $802,555
3
Beds
3
Baths
1,666
Sq Ft
$444/Sq Ft
Est. Value
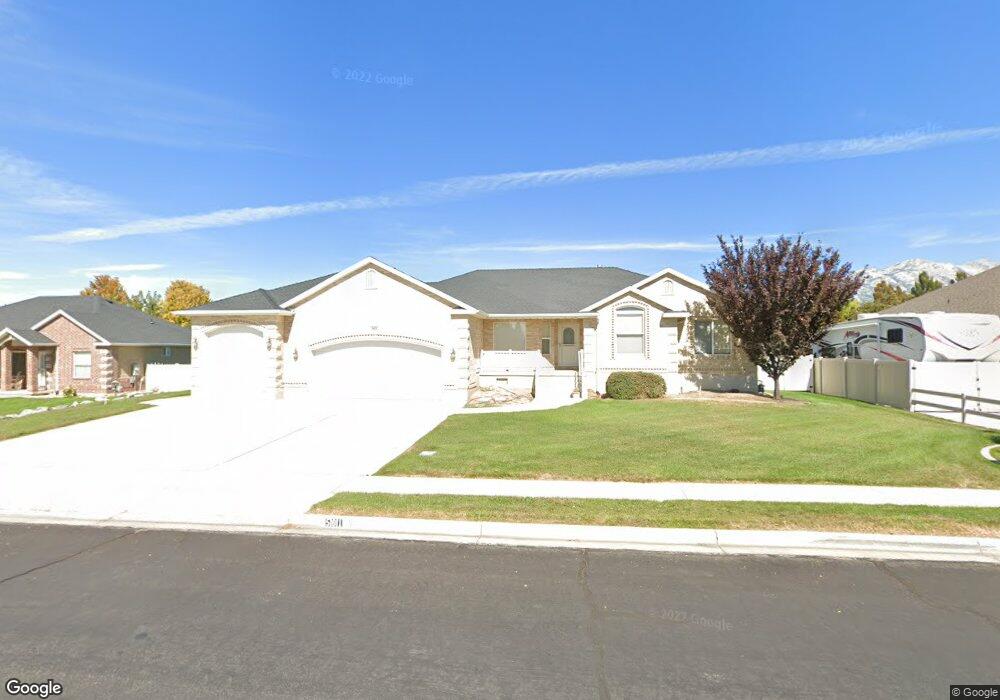
About This Home
This home is located at 501 E 2760 N, Lehi, UT 84043 and is currently estimated at $739,518, approximately $443 per square foot. 501 E 2760 N is a home located in Utah County with nearby schools including Eaglecrest Elementary School, Lehi Junior High School, and Skyridge High School.
Ownership History
Date
Name
Owned For
Owner Type
Purchase Details
Closed on
Oct 30, 2025
Sold by
Christensen Karl K
Bought by
Karl K Christensen Living Trust and Christensen
Current Estimated Value
Purchase Details
Closed on
Jan 23, 2002
Sold by
Elton William Thomas and Elton Janie Laverne
Bought by
Christensen Karl K
Home Financials for this Owner
Home Financials are based on the most recent Mortgage that was taken out on this home.
Original Mortgage
$199,100
Interest Rate
7.11%
Mortgage Type
Balloon
Create a Home Valuation Report for This Property
The Home Valuation Report is an in-depth analysis detailing your home's value as well as a comparison with similar homes in the area
Home Values in the Area
Average Home Value in this Area
Purchase History
| Date | Buyer | Sale Price | Title Company |
|---|---|---|---|
| Karl K Christensen Living Trust | -- | None Listed On Document | |
| Christensen Karl K | -- | -- |
Source: Public Records
Mortgage History
| Date | Status | Borrower | Loan Amount |
|---|---|---|---|
| Previous Owner | Christensen Karl K | $199,100 |
Source: Public Records
Tax History
| Year | Tax Paid | Tax Assessment Tax Assessment Total Assessment is a certain percentage of the fair market value that is determined by local assessors to be the total taxable value of land and additions on the property. | Land | Improvement |
|---|---|---|---|---|
| 2025 | $3,024 | $399,960 | -- | -- |
| 2024 | $3,024 | $353,925 | $0 | $0 |
| 2023 | $2,755 | $350,020 | $0 | $0 |
| 2022 | $2,854 | $351,560 | $0 | $0 |
| 2021 | $2,460 | $458,100 | $206,900 | $251,200 |
| 2020 | $2,316 | $426,400 | $191,600 | $234,800 |
| 2019 | $2,228 | $426,400 | $191,600 | $234,800 |
| 2018 | $2,314 | $418,700 | $183,900 | $234,800 |
| 2017 | $2,022 | $194,480 | $0 | $0 |
| 2016 | $1,898 | $169,345 | $0 | $0 |
| 2015 | $1,811 | $153,395 | $0 | $0 |
| 2014 | $1,793 | $151,030 | $0 | $0 |
Source: Public Records
Map
Nearby Homes
- 4233 N 325 E Unit 1415
- 3239 N 620 E
- 532 E 3270 N
- 878 E 3050 N
- 975 E 2850 N
- 3368 N 700 E
- 173 E Forehand Ln
- 398 W 2660 N
- 389 W 3200 N
- 242 W Glenbrittle Dr
- 4272 Braiken Ridge Dr Unit 105
- 5344 N Trail Side Ct
- 2139 N Banbury Ct
- 516 W 2280 N
- 10365 N 6960 W
- 548 W 2325 N
- 497 W 2200 N
- 1602 E Center Pointe Dr
- 1610 E Center Pointe Dr
- 1618 E Center Pointe Dr
Your Personal Tour Guide
Ask me questions while you tour the home.