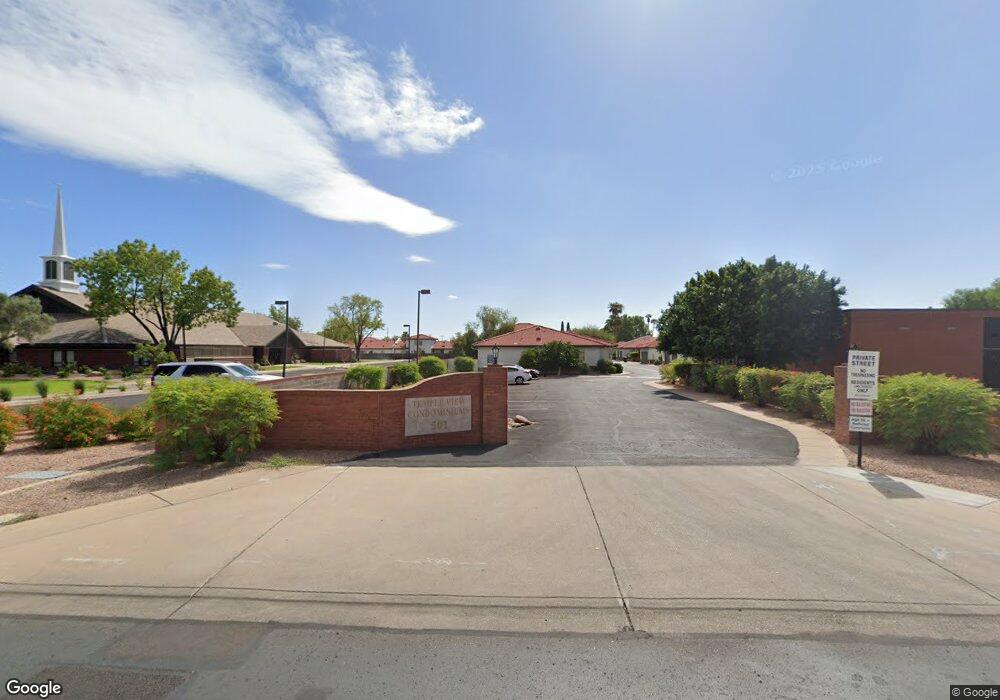
501 E 2nd Ave Unit 28 Mesa, AZ 85204
Temple NeighborhoodEstimated Value: $285,092 - $304,000
Studio
2
Baths
1,154
Sq Ft
$255/Sq Ft
Est. Value
About This Home
This home is located at 501 E 2nd Ave Unit 28, Mesa, AZ 85204 and is currently estimated at $294,273, approximately $255 per square foot. 501 E 2nd Ave Unit 28 is a home located in Maricopa County with nearby schools including Lowell Elementary School, Franklin at Brimhall Elementary School, and Franklin West Elementary School.
Ownership History
Date
Name
Owned For
Owner Type
Purchase Details
Closed on
Sep 22, 2025
Sold by
Turley Living Trust and Marshall Turley R
Bought by
Oettel Carmen
Current Estimated Value
Purchase Details
Closed on
Nov 1, 2016
Sold by
Turley Marshall and Turley Ellen
Bought by
Turley Turley R and Turley Ellen
Purchase Details
Closed on
Nov 17, 2004
Sold by
Hirst David K and Hirst Lianne P
Bought by
Turley Marshall and Turley Ellen
Purchase Details
Closed on
Jan 16, 2000
Sold by
Heywood Alfred L and Heywood Phyllis S
Bought by
Hirst David K and Hirst Lianne P
Home Financials for this Owner
Home Financials are based on the most recent Mortgage that was taken out on this home.
Original Mortgage
$60,900
Interest Rate
7.54%
Mortgage Type
Seller Take Back
Purchase Details
Closed on
Jul 13, 1999
Sold by
Lee Robert L and Taylor Monita W
Bought by
Heywood Alfred L and Heywood Phyllis S
Create a Home Valuation Report for This Property
The Home Valuation Report is an in-depth analysis detailing your home's value as well as a comparison with similar homes in the area
Home Values in the Area
Average Home Value in this Area
Purchase History
| Date | Buyer | Sale Price | Title Company |
|---|---|---|---|
| Oettel Carmen | $305,000 | Clear Title Agency Of Arizona | |
| Turley Turley R | -- | None Available | |
| Turley Marshall | $87,000 | Dhi Title | |
| Hirst David K | $87,000 | Transnation Title Insurance | |
| Heywood Alfred L | $85,000 | Transnation Title Ins Co |
Source: Public Records
Mortgage History
| Date | Status | Borrower | Loan Amount |
|---|---|---|---|
| Previous Owner | Hirst David K | $60,900 |
Source: Public Records
Tax History
| Year | Tax Paid | Tax Assessment Tax Assessment Total Assessment is a certain percentage of the fair market value that is determined by local assessors to be the total taxable value of land and additions on the property. | Land | Improvement |
|---|---|---|---|---|
| 2025 | $859 | $10,348 | -- | -- |
| 2024 | $869 | $9,855 | -- | -- |
| 2023 | $869 | $18,510 | $3,700 | $14,810 |
| 2022 | $850 | $14,420 | $2,880 | $11,540 |
| 2021 | $873 | $12,630 | $2,520 | $10,110 |
| 2020 | $861 | $10,930 | $2,180 | $8,750 |
| 2019 | $798 | $8,910 | $1,780 | $7,130 |
| 2018 | $762 | $9,030 | $1,800 | $7,230 |
| 2017 | $738 | $8,310 | $1,660 | $6,650 |
| 2016 | $724 | $8,020 | $1,600 | $6,420 |
| 2015 | $684 | $7,460 | $1,490 | $5,970 |
Source: Public Records
Map
Nearby Homes
- 511 E 3rd Ave
- 335 S Lesueur
- 259 S Olive
- 202 E 2nd Ave
- 427 E Crescent Ave
- 454 S Pioneer
- 455 S Mesa Dr Unit 104
- 750 E 1st Ave
- 526 S Mesa Dr
- 61 N Hibbert
- 523 S Pasadena -- S Unit 111
- 523 S Pasadena -- S Unit 113
- 523 S Pasadena -- S Unit 112
- 523 S Pasadena -- S Unit 116
- 523 S Pasadena -- S Unit 114
- 523 S Pasadena -- S Unit 115
- 421 E 6th Dr
- 133 N Hibbert
- 834 E Vine Ave
- 225 N Pomeroy Unit 6
- 501 E 2nd Ave Unit 3
- 501 E 2nd Ave Unit 25
- 501 E 2nd Ave Unit 13
- 501 E 2nd Ave Unit 35
- 501 E 2nd Ave Unit 5
- 501 E 2nd Ave Unit 27
- 501 E 2nd Ave Unit 29
- 501 E 2nd Ave Unit 8
- 501 E 2nd Ave Unit 9
- 501 E 2nd Ave Unit 11
- 501 E 2nd Ave Unit 22
- 501 E 2nd Ave Unit 34
- 501 E 2nd Ave Unit 16
- 501 E 2nd Ave Unit 32
- 501 E 2nd Ave Unit 18
- 501 E 2nd Ave Unit 2
- 501 E 2nd Ave Unit 4
- 501 E 2nd Ave Unit 23
- 501 E 2nd Ave Unit 19
- 501 E 2nd Ave Unit 12
Your Personal Tour Guide
Ask me questions while you tour the home.