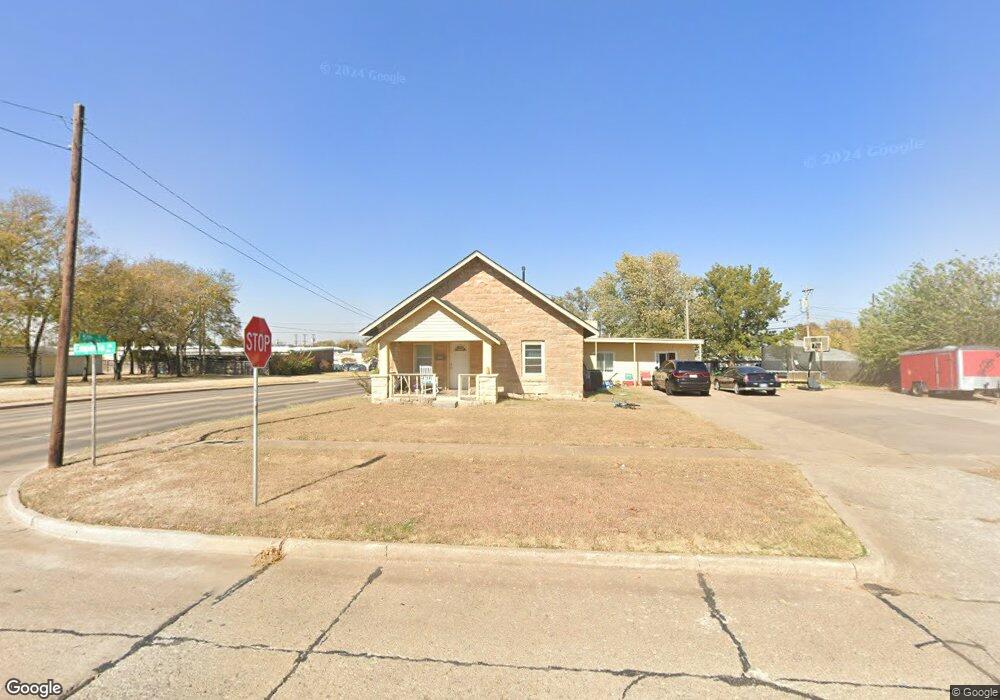
501 E Emporia Ave Ponca City, OK 74601
Estimated Value: $151,000 - $182,671
4
Beds
2
Baths
3,192
Sq Ft
$51/Sq Ft
Est. Value
About This Home
This home is located at 501 E Emporia Ave, Ponca City, OK 74601 and is currently estimated at $164,168, approximately $51 per square foot. 501 E Emporia Ave is a home with nearby schools including Roosevelt Elementary School, Ponca City East Middle School, and Ponca City West Middle School.
Ownership History
Date
Name
Owned For
Owner Type
Purchase Details
Closed on
Jun 1, 2022
Sold by
Kim Le Thien
Bought by
Williams Matheanna
Current Estimated Value
Home Financials for this Owner
Home Financials are based on the most recent Mortgage that was taken out on this home.
Original Mortgage
$122,735
Outstanding Balance
$116,608
Interest Rate
5.1%
Mortgage Type
FHA
Estimated Equity
$47,560
Purchase Details
Closed on
Apr 24, 2018
Sold by
Rcb Bank
Bought by
Le Thien Kim Thi
Purchase Details
Closed on
Oct 17, 2005
Sold by
Field Kenneth E and Field Elsie M
Bought by
Emporia Place Llc
Home Financials for this Owner
Home Financials are based on the most recent Mortgage that was taken out on this home.
Original Mortgage
$72,000
Interest Rate
5.73%
Mortgage Type
Commercial
Purchase Details
Closed on
Aug 1, 2001
Sold by
Josette Donald and Josette Kelle
Bought by
Elsie Kenneth and Elsie Field
Create a Home Valuation Report for This Property
The Home Valuation Report is an in-depth analysis detailing your home's value as well as a comparison with similar homes in the area
Home Values in the Area
Average Home Value in this Area
Purchase History
| Date | Buyer | Sale Price | Title Company |
|---|---|---|---|
| Williams Matheanna | $125,000 | None Listed On Document | |
| Le Thien Kim Thi | $53,000 | None Available | |
| Emporia Place Llc | -- | -- | |
| Elsie Kenneth | $35,000 | -- |
Source: Public Records
Mortgage History
| Date | Status | Borrower | Loan Amount |
|---|---|---|---|
| Open | Williams Matheanna | $122,735 | |
| Previous Owner | Emporia Place Llc | $72,000 |
Source: Public Records
Tax History Compared to Growth
Tax History
| Year | Tax Paid | Tax Assessment Tax Assessment Total Assessment is a certain percentage of the fair market value that is determined by local assessors to be the total taxable value of land and additions on the property. | Land | Improvement |
|---|---|---|---|---|
| 2024 | $1,367 | $14,438 | $960 | $13,478 |
| 2023 | $1,367 | $13,750 | $955 | $12,795 |
| 2022 | $563 | $5,919 | $963 | $4,956 |
| 2021 | $566 | $5,919 | $963 | $4,956 |
| 2020 | $560 | $5,919 | $963 | $4,956 |
| 2019 | $588 | $6,154 | $963 | $5,191 |
| 2018 | $612 | $6,324 | $963 | $5,361 |
| 2017 | $590 | $6,023 | $963 | $5,060 |
| 2016 | $640 | $6,463 | $963 | $5,500 |
| 2015 | $653 | $6,562 | $963 | $5,599 |
| 2014 | $694 | $7,108 | $963 | $6,145 |
Source: Public Records
Map
Nearby Homes
- 304 E Detroit Ave
- 113 E Fresno Ave
- 2000 N 5th St
- 2005 N 4th St
- 1412 Donahoe Dr
- 1013 N 7th St
- 1217 N Pine St
- 734 E Albany Ave
- 1008 N 1st St
- 0000 N Union St
- 121 Hillside Ave
- 1016 N Oak St
- 1128 N 14th St
- 106 Elmwood Ave
- 1708 Potomac Dr
- 214 Virginia Ave
- 3651 N 14th St
- 734 N 2nd St
- TBD 5th and Windsor
- 505 N Pine St
- 511 E Emporia Ave
- 413 E Emporia Ave
- 1620 N 6th St
- 1516 N 5th St
- 411 E Emporia Ave
- 406 E Fresno Ave
- 408 E Emporia Ave
- 401 E Emporia Ave
- 501 E Fresno Ave
- 505 E Fresno Ave
- 601 E Emporia Ave
- 509 E Fresno Ave
- 404 E Emporia Ave
- 1500 N 5th St
- 600 E Fresno Ave
- 1617 N 4th St
- 513 E Fresno Ave
- 413 E Detroit Ave
- 600 E Emporia Ave
- 605 E Emporia Ave