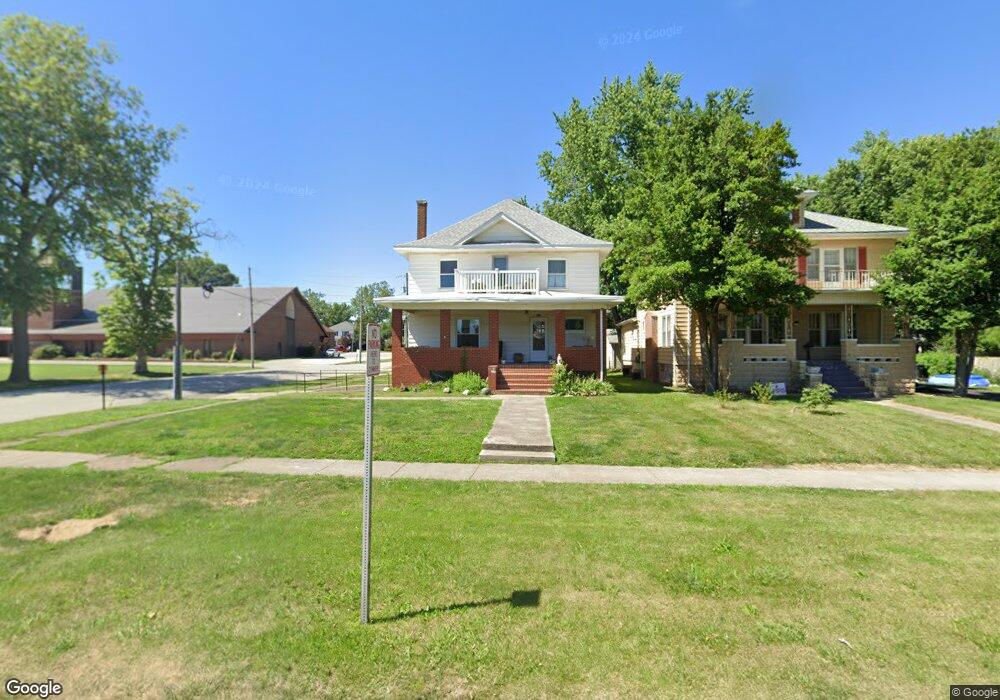
501 E Union Ave Litchfield, IL 62056
Estimated Value: $92,000 - $208,000
4
Beds
2
Baths
2,250
Sq Ft
$65/Sq Ft
Est. Value
About This Home
This home is located at 501 E Union Ave, Litchfield, IL 62056 and is currently estimated at $145,560, approximately $64 per square foot. 501 E Union Ave is a home located in Montgomery County with nearby schools including Madison Park Elementary School, Litchfield Elementary School, and J.D. Colt Elementary School.
Ownership History
Date
Name
Owned For
Owner Type
Purchase Details
Closed on
Jun 5, 2013
Sold by
Fannie Mae
Bought by
Holloway Eric G
Current Estimated Value
Home Financials for this Owner
Home Financials are based on the most recent Mortgage that was taken out on this home.
Original Mortgage
$27,920
Outstanding Balance
$19,579
Interest Rate
3.25%
Mortgage Type
New Conventional
Estimated Equity
$125,981
Purchase Details
Closed on
Jan 14, 2013
Sold by
Denton Shawn M
Bought by
Federal Home Loan Mortgage Corporation
Purchase Details
Closed on
Jun 10, 2005
Sold by
Adair Holdings Llc
Bought by
Denton Shawn M
Home Financials for this Owner
Home Financials are based on the most recent Mortgage that was taken out on this home.
Original Mortgage
$53,940
Interest Rate
6%
Mortgage Type
Purchase Money Mortgage
Create a Home Valuation Report for This Property
The Home Valuation Report is an in-depth analysis detailing your home's value as well as a comparison with similar homes in the area
Home Values in the Area
Average Home Value in this Area
Purchase History
| Date | Buyer | Sale Price | Title Company |
|---|---|---|---|
| Holloway Eric G | $35,000 | -- | |
| Federal Home Loan Mortgage Corporation | -- | None Available | |
| Denton Shawn M | $60,000 | Communmity Title & Escrow |
Source: Public Records
Mortgage History
| Date | Status | Borrower | Loan Amount |
|---|---|---|---|
| Open | Holloway Eric G | $27,920 | |
| Previous Owner | Denton Shawn M | $53,940 |
Source: Public Records
Tax History
| Year | Tax Paid | Tax Assessment Tax Assessment Total Assessment is a certain percentage of the fair market value that is determined by local assessors to be the total taxable value of land and additions on the property. | Land | Improvement |
|---|---|---|---|---|
| 2024 | $2,485 | $35,520 | $5,570 | $29,950 |
| 2023 | $2,363 | $33,550 | $5,260 | $28,290 |
| 2022 | $2,249 | $31,660 | $4,960 | $26,700 |
| 2021 | $2,177 | $30,640 | $4,800 | $25,840 |
| 2020 | $2,036 | $29,050 | $4,550 | $24,500 |
| 2019 | $1,764 | $25,290 | $9,100 | $16,190 |
| 2018 | $1,749 | $24,520 | $8,820 | $15,700 |
| 2017 | $1,731 | $24,190 | $8,700 | $15,490 |
| 2016 | $1,691 | $23,490 | $8,450 | $15,040 |
| 2015 | $1,623 | $23,650 | $8,510 | $15,140 |
| 2013 | -- | $23,270 | $8,370 | $14,900 |
Source: Public Records
Map
Nearby Homes
- 419 E Corwin St
- 616 E Ryder St
- 903 N Van Buren St
- 822 E Union Ave
- 704 N Monroe St
- TBD N Van Buren St
- 1003 N Monroe St
- 821 N State St
- 104 W Edwards St
- 227 S Montgomery Ave
- 1110 N Walnut St
- 203 E Martin St
- TBD N Madison St
- 916 N Locust St
- 920 E Martin St
- 1402 N Harrison St
- 215 W Palmer St
- 711 S Franklin St
- 1015 E Clark St
- 1512 N Harrison St
- 503 E Union Ave
- 602 N Harrison St
- 608 N Harrison St
- 612 N Harrison St
- 502 E Union Ave
- 601 N Franklin St
- 605 N Franklin St
- 508 E Union Ave
- 520 E Union Ave
- 618 N Harrison St
- 607 N Franklin St
- 624 N Harrison St
- 528 E Union Ave
- 625 N Franklin St
- 625 N Franklin St
- 508 N Franklin St
- 532 E Union Ave
- 602 E Union Ave
- 326 N Harrison St
- 612 N Franklin St
Your Personal Tour Guide
Ask me questions while you tour the home.