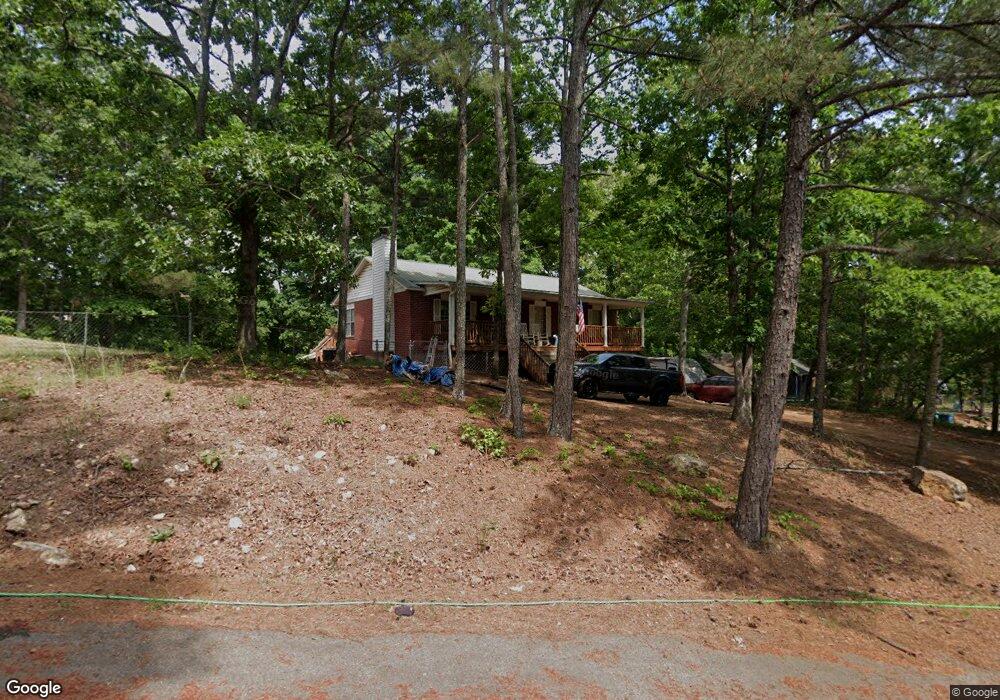
501 Fieldcrest Dr Statham, GA 30666
Estimated Value: $273,000 - $305,000
4
Beds
3
Baths
1,320
Sq Ft
$221/Sq Ft
Est. Value
About This Home
This home is located at 501 Fieldcrest Dr, Statham, GA 30666 and is currently estimated at $292,364, approximately $221 per square foot. 501 Fieldcrest Dr is a home located in Barrow County with nearby schools including Statham Elementary School, Bear Creek Middle School, and Winder-Barrow High School.
Ownership History
Date
Name
Owned For
Owner Type
Purchase Details
Closed on
Nov 10, 2010
Sold by
Sailors Dean
Bought by
Frank Timothy and Frank Deborah
Current Estimated Value
Home Financials for this Owner
Home Financials are based on the most recent Mortgage that was taken out on this home.
Original Mortgage
$98,445
Outstanding Balance
$65,283
Interest Rate
4.37%
Mortgage Type
New Conventional
Estimated Equity
$227,081
Purchase Details
Closed on
Oct 4, 2010
Sold by
Griffin April S
Bought by
Sailors Dean
Home Financials for this Owner
Home Financials are based on the most recent Mortgage that was taken out on this home.
Original Mortgage
$98,445
Outstanding Balance
$65,283
Interest Rate
4.37%
Mortgage Type
New Conventional
Estimated Equity
$227,081
Purchase Details
Closed on
Aug 26, 2010
Sold by
Ace Secs Cor Trust 2006-Nc1
Bought by
Sailors Dean and Griffin April
Purchase Details
Closed on
Jan 5, 2010
Sold by
Hellums Jeffrey B and Hellums Christina S
Bought by
Ace Secs Corp Trust 2006-Nc1
Create a Home Valuation Report for This Property
The Home Valuation Report is an in-depth analysis detailing your home's value as well as a comparison with similar homes in the area
Home Values in the Area
Average Home Value in this Area
Purchase History
| Date | Buyer | Sale Price | Title Company |
|---|---|---|---|
| Frank Timothy | $92,500 | -- | |
| Sailors Dean | -- | -- | |
| Sailors Dean | $33,000 | -- | |
| Ace Secs Corp Trust 2006-Nc1 | $63,665 | -- | |
| Hsbc Bank Usa Na Ace 2006-Nc1 | -- | -- |
Source: Public Records
Mortgage History
| Date | Status | Borrower | Loan Amount |
|---|---|---|---|
| Open | Frank Timothy | $98,445 |
Source: Public Records
Tax History Compared to Growth
Tax History
| Year | Tax Paid | Tax Assessment Tax Assessment Total Assessment is a certain percentage of the fair market value that is determined by local assessors to be the total taxable value of land and additions on the property. | Land | Improvement |
|---|---|---|---|---|
| 2024 | $2,456 | $82,503 | $16,000 | $66,503 |
| 2023 | $2,119 | $82,503 | $16,000 | $66,503 |
| 2022 | $1,649 | $55,760 | $16,000 | $39,760 |
| 2021 | $1,535 | $48,447 | $12,000 | $36,447 |
| 2020 | $1,375 | $43,134 | $10,000 | $33,134 |
| 2019 | $1,395 | $43,134 | $10,000 | $33,134 |
| 2018 | $1,392 | $43,134 | $10,000 | $33,134 |
| 2017 | $1,327 | $38,021 | $10,000 | $28,021 |
| 2016 | $1,251 | $38,696 | $10,000 | $28,696 |
| 2015 | $1,263 | $39,034 | $10,000 | $29,034 |
| 2014 | $1,074 | $34,271 | $4,900 | $29,371 |
| 2013 | -- | $32,529 | $4,900 | $27,629 |
Source: Public Records
Map
Nearby Homes
- 0 Mccarty Rd Unit 10583122
- 0 Mccarty Rd Unit CL338739
- 0 Mccarty Rd Unit 10587569
- 0 Mccarty Rd Unit 7620562
- 1475 Whispering Way
- 2143 Whispering Way
- 2095 Whispering Way
- 390 Sunset Dr
- 0 Georgia 316
- 26 Lyles Corner
- 43 Lyles Corner
- 576 Lillian Way
- 384 Sunset Dr
- 385 Sunset Dr
- 79 Lyles Corner
- 361 Price St
- 1679 Atlanta Hwy SE
- 364 Pleasant Hill Church Rd SE
- 1907 Broad St
- 344 Pleasant Hill Church Rd SE
- 497 Fieldcrest Dr
- 515 Fieldcrest Dr
- 0 Fieldcrest Dr Unit 3218660
- 0 Fieldcrest Dr
- 487 Mccarty Rd
- 0 Mccarty Rd Unit 7631622
- 0 Mccarty Rd Unit 3156182
- 0 Mccarty Rd Unit 8442198
- 0 Mccarty Rd Unit 8471902
- 0 Mccarty Rd Unit 8497061
- 479 Mccarty Rd
- 0 McCarty Rd and Hwy 316
- 0 McCarty Rd & Hwy 316
- 0 McCarty Rd and Hwy 316 Unit 8252801
- 475 Mccarty Rd
- 496 Mccarty Rd
- 511 Mccarty Rd
- 541 Fieldcrest Dr
- 471 Mccarty Rd
- 489 Whispering Oaks Dr