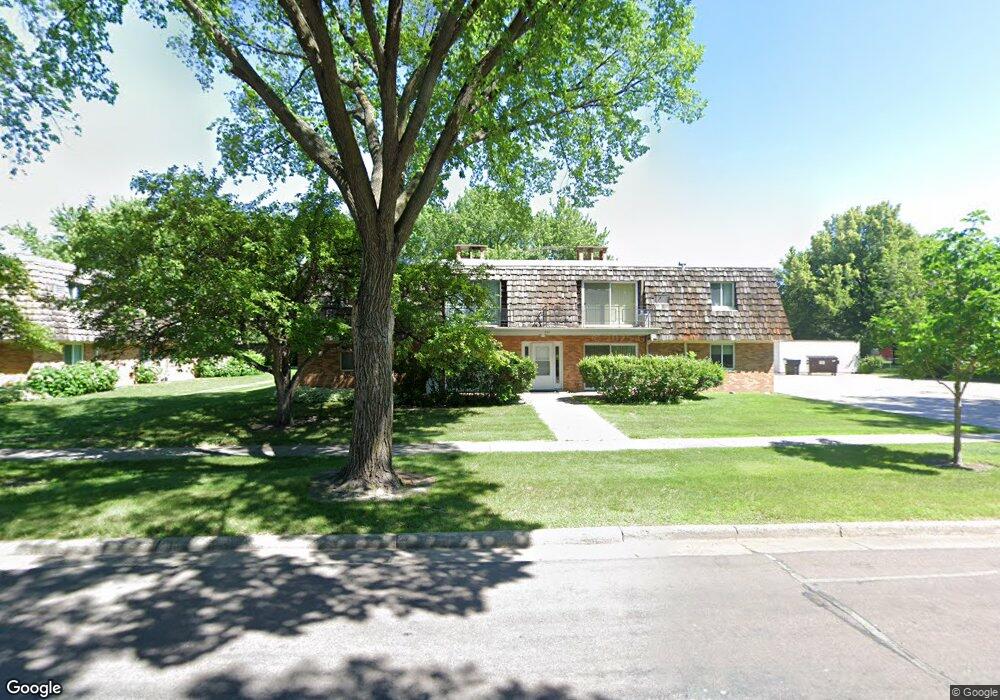
501 Forest Ave N Unit A Fargo, ND 58102
Northport NeighborhoodEstimated Value: $108,000 - $152,000
2
Beds
1
Bath
886
Sq Ft
$136/Sq Ft
Est. Value
About This Home
This home is located at 501 Forest Ave N Unit A, Fargo, ND 58102 and is currently estimated at $120,440, approximately $135 per square foot. 501 Forest Ave N Unit A is a home located in Cass County with nearby schools including McKinley Elementary School, Ben Franklin Middle School, and North High School.
Ownership History
Date
Name
Owned For
Owner Type
Purchase Details
Closed on
Sep 27, 2013
Sold by
Kolrud John E and Kolrud Arlene J
Bought by
Brainerd Cynthia G and Kolrud Mitchell J
Current Estimated Value
Purchase Details
Closed on
Nov 2, 2010
Sold by
Farnham Naomi M
Bought by
Kolrud John E and Kolrud Arlene J
Create a Home Valuation Report for This Property
The Home Valuation Report is an in-depth analysis detailing your home's value as well as a comparison with similar homes in the area
Home Values in the Area
Average Home Value in this Area
Purchase History
| Date | Buyer | Sale Price | Title Company |
|---|---|---|---|
| Brainerd Cynthia G | -- | None Available | |
| Kolrud John E | -- | -- |
Source: Public Records
Tax History Compared to Growth
Tax History
| Year | Tax Paid | Tax Assessment Tax Assessment Total Assessment is a certain percentage of the fair market value that is determined by local assessors to be the total taxable value of land and additions on the property. | Land | Improvement |
|---|---|---|---|---|
| 2024 | $1,320 | $47,900 | $6,950 | $40,950 |
| 2023 | $1,313 | $47,900 | $6,950 | $40,950 |
| 2022 | $1,296 | $46,500 | $6,950 | $39,550 |
| 2021 | $1,273 | $46,500 | $6,950 | $39,550 |
| 2020 | $1,257 | $46,500 | $6,950 | $39,550 |
| 2019 | $1,258 | $46,500 | $3,850 | $42,650 |
| 2018 | $1,054 | $40,200 | $3,850 | $36,350 |
| 2017 | $1,044 | $39,050 | $3,850 | $35,200 |
| 2016 | $857 | $35,500 | $3,850 | $31,650 |
| 2015 | $938 | $35,500 | $2,900 | $32,600 |
| 2014 | $957 | $36,350 | $2,900 | $33,450 |
| 2013 | $958 | $36,350 | $2,900 | $33,450 |
Source: Public Records
Map
Nearby Homes
- 501 Forest Ave N Unit C
- 2902 3rd St N
- 2807 Edgewood Dr N
- 310 27th Ave N
- 2926 Edgewood Dr N
- 3113 8th St N
- 2925 Edgewood Dr N
- 2937 Edgewood Dr N
- 3129 8th St N
- 418 25th Ave N
- 801 32nd Ave N Unit A102
- 2512 2nd St N
- 87 28th Ave N
- 101 27th Ave N
- 3217 Cherry Ln N
- 108 32nd Ave N
- 207 23rd Ave N
- 2510 10th St N
- 3306 2nd St N Unit D26
- 2510 Evergreen Rd N
- 501 Forest Ave N Unit F
- 501 Forest Ave N Unit H
- 501 Forest Ave N Unit G
- 501 Forest Ave N Unit D
- 501 Forest Ave N Unit B
- 501 Forest Ave N
- 415 Forest Ave N
- 511 Forest Ave N Unit G
- 511 Forest Ave N Unit E
- 511 Forest Ave N Unit H
- 511 Forest Ave N Unit F
- 511 Forest Ave N Unit D
- 511 Forest Ave N Unit B
- 511 Forest Ave N Unit A
- 511 Forest Ave N
- 409 Forest Ave N
- 418 Forest Ave N
- 502 Forest Ave N
- 414 Forest Ave N
- 405 Forest Ave N