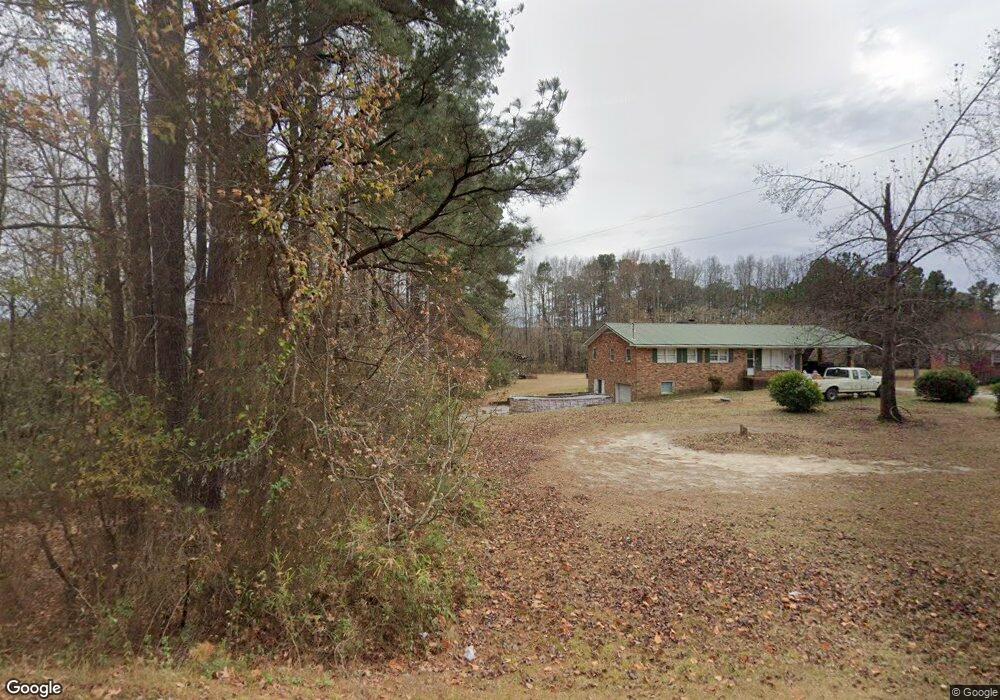
501 Gay Rd Zebulon, NC 27597
Estimated Value: $279,754 - $296,000
3
Beds
1
Bath
1,155
Sq Ft
$247/Sq Ft
Est. Value
About This Home
This home is located at 501 Gay Rd, Zebulon, NC 27597 and is currently estimated at $285,689, approximately $247 per square foot. 501 Gay Rd is a home located in Franklin County with nearby schools including Bunn Elementary School, Bunn Middle School, and Bunn High School.
Ownership History
Date
Name
Owned For
Owner Type
Purchase Details
Closed on
Jul 22, 2025
Sold by
Crabtree Tanner and Spencer Tommy
Bought by
Nelson Randall Edward and Nelson Lauren Ashley
Current Estimated Value
Home Financials for this Owner
Home Financials are based on the most recent Mortgage that was taken out on this home.
Original Mortgage
$174,000
Outstanding Balance
$172,799
Interest Rate
5.99%
Mortgage Type
New Conventional
Estimated Equity
$112,890
Purchase Details
Closed on
Jun 27, 2024
Sold by
Corster Home Improvement Llc
Bought by
Crabtree Tanner and Spencer Tommy
Home Financials for this Owner
Home Financials are based on the most recent Mortgage that was taken out on this home.
Original Mortgage
$228,000
Interest Rate
7.02%
Mortgage Type
New Conventional
Purchase Details
Closed on
Nov 1, 2023
Sold by
Morgan Crettie M and Morgan Lisa Michelle
Bought by
Corster Home Improvement Llc
Purchase Details
Closed on
Mar 1, 2004
Bought by
Mitchell Jerry W and Mitchell Crettie H
Create a Home Valuation Report for This Property
The Home Valuation Report is an in-depth analysis detailing your home's value as well as a comparison with similar homes in the area
Home Values in the Area
Average Home Value in this Area
Purchase History
| Date | Buyer | Sale Price | Title Company |
|---|---|---|---|
| Nelson Randall Edward | $294,000 | None Listed On Document | |
| Crabtree Tanner | $285,000 | None Listed On Document | |
| Corster Home Improvement Llc | $165,000 | None Listed On Document | |
| Mitchell Jerry W | $37,500 | -- |
Source: Public Records
Mortgage History
| Date | Status | Borrower | Loan Amount |
|---|---|---|---|
| Open | Nelson Randall Edward | $174,000 | |
| Previous Owner | Crabtree Tanner | $228,000 |
Source: Public Records
Tax History Compared to Growth
Tax History
| Year | Tax Paid | Tax Assessment Tax Assessment Total Assessment is a certain percentage of the fair market value that is determined by local assessors to be the total taxable value of land and additions on the property. | Land | Improvement |
|---|---|---|---|---|
| 2024 | $1,239 | $199,750 | $40,000 | $159,750 |
| 2023 | $987 | $102,590 | $27,500 | $75,090 |
| 2022 | $962 | $102,590 | $27,500 | $75,090 |
| 2021 | $972 | $102,590 | $27,500 | $75,090 |
| 2020 | $978 | $102,590 | $27,500 | $75,090 |
| 2019 | $968 | $102,590 | $27,500 | $75,090 |
| 2018 | $963 | $102,590 | $27,500 | $75,090 |
| 2017 | $812 | $78,640 | $25,000 | $53,640 |
| 2016 | $839 | $78,640 | $25,000 | $53,640 |
| 2015 | $839 | $78,640 | $25,000 | $53,640 |
| 2014 | $773 | $78,640 | $25,000 | $53,640 |
Source: Public Records
Map
Nearby Homes
- 8420 Hopkins Glen Way
- 45 Addison Pond Ct
- Lot 6 Triskel Ln
- 46 Addison Pond Ct
- 8524 Pascolo Way
- Lot 5 Triskel
- 305 Leghorn Dr
- 5008 Hopkins Chapel Rd
- 5009 Hopkins Chapel Rd
- 105 Perry Ln
- 25 Diamond Creek Dr
- 15 Diamond Creek Dr
- 20 Diamond Creek Dr
- Dunlin Plan at Kettle Creek
- Tryon Plan at Kettle Creek
- Fuller Plan at Kettle Creek
- Jasmine Plan at Kettle Creek
- Eleanor Plan at Kettle Creek
- Tundra Plan at Kettle Creek
- Sandpiper Plan at Kettle Creek