K
Seller's Agent in 2012
Kevin Randleman
Iowa Realty South
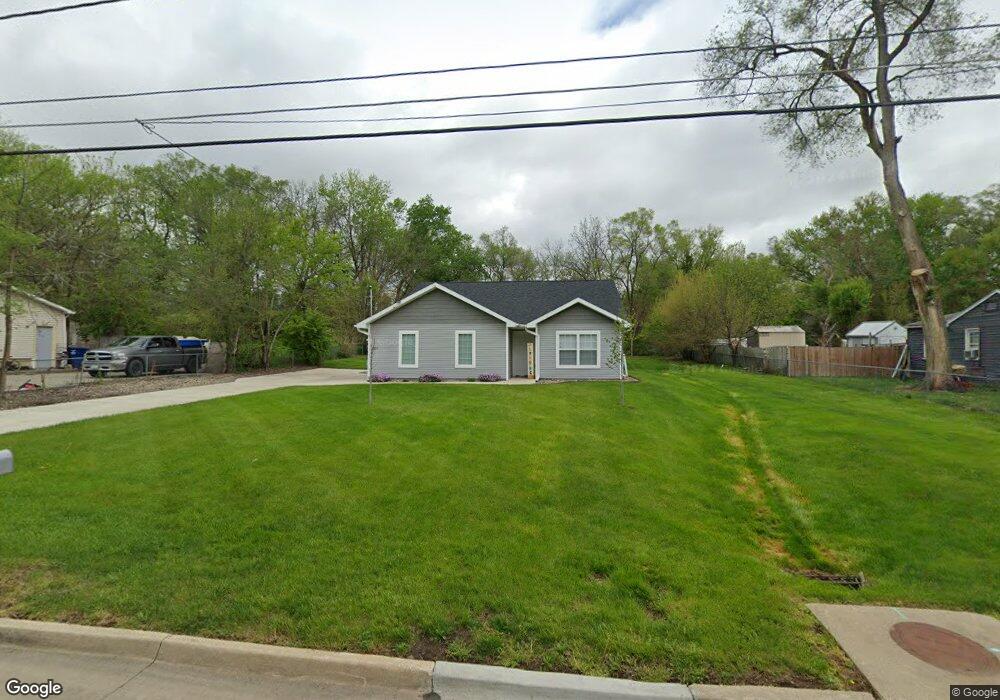
Estimated Value: $221,000 - $282,819
24 hour sold listing
Last Agent to Sell the Property
Kevin Randleman
Iowa Realty South Listed on: 11/17/2012
Co-Listed By
Sue Randleman
Iowa Realty South
Last Buyer's Agent
Kevin Randleman
Iowa Realty South Listed on: 11/17/2012
| Date | Buyer | Sale Price | Title Company |
|---|---|---|---|
| Fanning Jeffrey | -- | None Listed On Document | |
| Hurd Stephen W | $12,000 | None Available | |
| Larsen Laverne | -- | -- | |
| Fuller Londa L | -- | -- |
| Date | Event | Price | List to Sale | Price per Sq Ft |
|---|---|---|---|---|
| 12/12/2012 12/12/12 | Sold | $12,000 | -20.0% | -- |
| 11/30/2012 11/30/12 | Pending | -- | -- | -- |
| 11/17/2012 11/17/12 | For Sale | $15,000 | -- | -- |
| Year | Tax Paid | Tax Assessment Tax Assessment Total Assessment is a certain percentage of the fair market value that is determined by local assessors to be the total taxable value of land and additions on the property. | Land | Improvement |
|---|---|---|---|---|
| 2025 | $652 | $248,000 | $47,200 | $200,800 |
| 2024 | $652 | $33,120 | $33,120 | $0 |
| 2023 | $642 | $220,600 | $41,400 | $179,200 |
| 2022 | $636 | $27,200 | $27,200 | $0 |
| 2021 | $596 | $27,200 | $27,200 | $0 |
| 2020 | $620 | $23,900 | $23,900 | $0 |
| 2019 | $564 | $23,900 | $23,900 | $0 |
| 2018 | $558 | $21,000 | $21,000 | $0 |
| 2017 | $516 | $21,000 | $21,000 | $0 |
| 2016 | $504 | $19,100 | $19,100 | $0 |
| 2015 | $504 | $19,100 | $19,100 | $0 |
| 2014 | $460 | $17,300 | $17,300 | $0 |
K
Seller's Agent in 2012
Kevin Randleman
Iowa Realty South
S
Seller Co-Listing Agent in 2012
Sue Randleman
Iowa Realty South
Source: Des Moines Area Association of REALTORS®
MLS Number: 409655
APN: 120-01410001000
Disclaimer: Certain information contained herein is derived from information provided by parties other than Homes.com. All information provided is deemed reliable, but is not guaranteed to be accurate and should be independently verified.
![]() IDX information is provided exclusively for personal, non-commercial use, and may not be used for any purpose other than to identify prospective properties consumers may be interested in purchasing. Information is deemed reliable but not guaranteed.
IDX information is provided exclusively for personal, non-commercial use, and may not be used for any purpose other than to identify prospective properties consumers may be interested in purchasing. Information is deemed reliable but not guaranteed.
Ask me questions while you tour the home.
