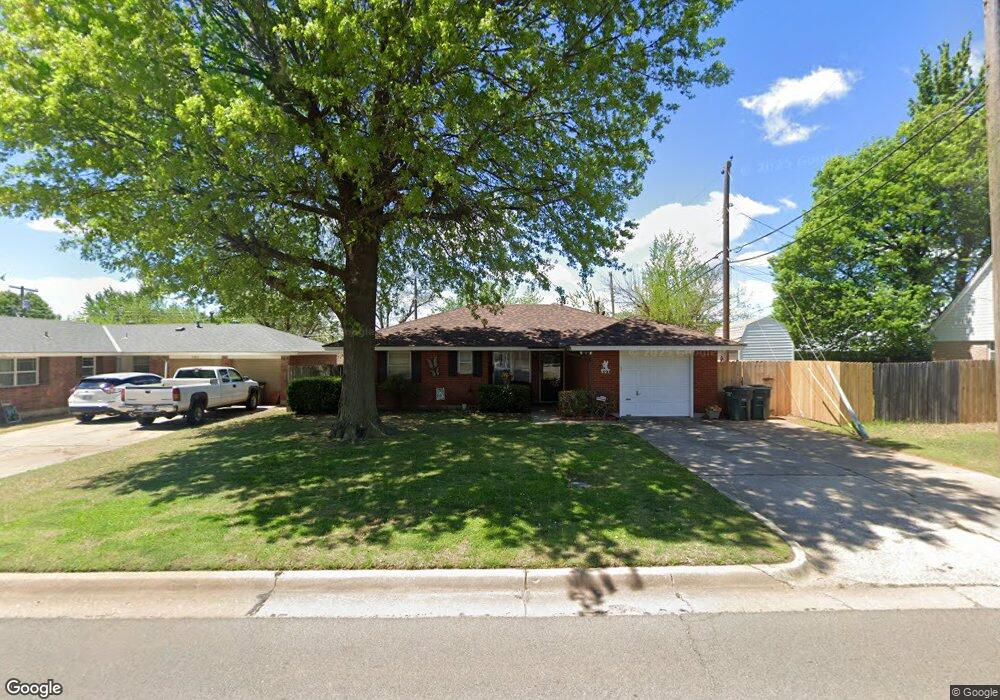
501 Howard Dr Oklahoma City, OK 73115
Estimated Value: $147,754 - $163,000
2
Beds
2
Baths
993
Sq Ft
$158/Sq Ft
Est. Value
About This Home
This home is located at 501 Howard Dr, Oklahoma City, OK 73115 and is currently estimated at $156,439, approximately $157 per square foot. 501 Howard Dr is a home located in Oklahoma County with nearby schools including Bonham Elementary School, Midwest City Elementary School, and Rice Challenge Academy.
Ownership History
Date
Name
Owned For
Owner Type
Purchase Details
Closed on
Jun 10, 2003
Sold by
Christ Belinda K
Bought by
Stump Robyn R
Current Estimated Value
Purchase Details
Closed on
Jan 22, 2002
Sold by
Va
Bought by
Christ Belinda K
Purchase Details
Closed on
Jul 23, 2001
Sold by
Ayala Luis Enrique and Ayala Maria D
Bought by
Va
Purchase Details
Closed on
Nov 13, 1997
Sold by
Ayala Luis Enrique
Bought by
Ayala Luis E and Ayala Maria
Home Financials for this Owner
Home Financials are based on the most recent Mortgage that was taken out on this home.
Original Mortgage
$38,480
Interest Rate
7.12%
Mortgage Type
Purchase Money Mortgage
Create a Home Valuation Report for This Property
The Home Valuation Report is an in-depth analysis detailing your home's value as well as a comparison with similar homes in the area
Home Values in the Area
Average Home Value in this Area
Purchase History
| Date | Buyer | Sale Price | Title Company |
|---|---|---|---|
| Stump Robyn R | $71,500 | First Amer Title & Trust Co | |
| Christ Belinda K | -- | Stewart Escrow & Title | |
| Va | -- | American Guaranty Title Co | |
| Ayala Luis E | -- | -- |
Source: Public Records
Mortgage History
| Date | Status | Borrower | Loan Amount |
|---|---|---|---|
| Previous Owner | Ayala Luis E | $38,480 |
Source: Public Records
Tax History Compared to Growth
Tax History
| Year | Tax Paid | Tax Assessment Tax Assessment Total Assessment is a certain percentage of the fair market value that is determined by local assessors to be the total taxable value of land and additions on the property. | Land | Improvement |
|---|---|---|---|---|
| 2024 | $1,138 | $11,451 | $1,844 | $9,607 |
| 2023 | $1,138 | $11,117 | $1,356 | $9,761 |
| 2022 | $1,085 | $10,794 | $1,454 | $9,340 |
| 2021 | $1,087 | $10,480 | $1,666 | $8,814 |
| 2020 | $1,080 | $10,175 | $1,845 | $8,330 |
| 2019 | $1,044 | $10,140 | $1,636 | $8,504 |
| 2018 | $1,024 | $9,845 | $0 | $0 |
| 2017 | $1,007 | $9,638 | $1,678 | $7,960 |
| 2016 | $1,002 | $9,357 | $1,638 | $7,719 |
| 2015 | $975 | $9,085 | $1,707 | $7,378 |
| 2014 | $940 | $8,821 | $1,749 | $7,072 |
Source: Public Records
Map
Nearby Homes
- 4720 Trapp Dr
- 410 Vickie Dr
- 4916 Jeffery Dr
- 605 S Sooner Rd
- 4937 Jeffery Dr
- 310 S Sooner Rd
- 4800 Gina Place
- 1017 Howard Dr
- 4812 Del Crest Dr
- 816 S Sooner Rd
- 5804 SE 7th St
- 4761 Koelsch Dr
- 4412 E Reno St
- 720 Del Haven Dr
- 1311 Sean Ct
- 1306 Sean Ct
- 4408 E Reno Ave
- 613 Mark Dr
- 1318 Alviola Ave
- 1321 Alviola Ave