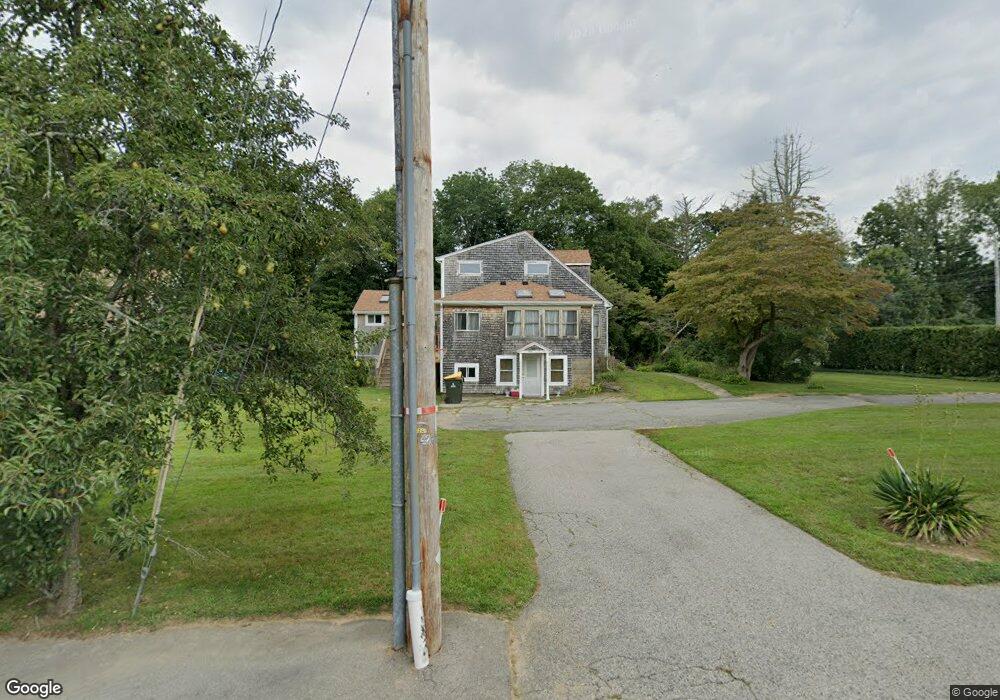
501 Indian Head St Hanson, MA 02341
Estimated Value: $635,067 - $699,000
3
Beds
2
Baths
2,074
Sq Ft
$318/Sq Ft
Est. Value
About This Home
This home is located at 501 Indian Head St, Hanson, MA 02341 and is currently estimated at $658,517, approximately $317 per square foot. 501 Indian Head St is a home located in Plymouth County.
Ownership History
Date
Name
Owned For
Owner Type
Purchase Details
Closed on
Feb 12, 2020
Sold by
Burgess Robert A
Bought by
Burgess Rt
Current Estimated Value
Purchase Details
Closed on
Nov 17, 2006
Sold by
Burgess Robert A and Burgess Lila M
Bought by
Burgess Robert A
Home Financials for this Owner
Home Financials are based on the most recent Mortgage that was taken out on this home.
Original Mortgage
$360,000
Interest Rate
6.33%
Mortgage Type
Purchase Money Mortgage
Purchase Details
Closed on
Apr 1, 1991
Sold by
Gates Robert E and Gates Teresa A
Bought by
Burgess Robert A and Burgess Lila M
Create a Home Valuation Report for This Property
The Home Valuation Report is an in-depth analysis detailing your home's value as well as a comparison with similar homes in the area
Home Values in the Area
Average Home Value in this Area
Purchase History
| Date | Buyer | Sale Price | Title Company |
|---|---|---|---|
| Burgess Rt | -- | None Available | |
| Burgess Robert A | -- | -- | |
| Burgess Robert A | $139,900 | -- |
Source: Public Records
Mortgage History
| Date | Status | Borrower | Loan Amount |
|---|---|---|---|
| Previous Owner | Burgess Robert A | $366,300 | |
| Previous Owner | Burgess Robert A | $360,000 |
Source: Public Records
Tax History Compared to Growth
Tax History
| Year | Tax Paid | Tax Assessment Tax Assessment Total Assessment is a certain percentage of the fair market value that is determined by local assessors to be the total taxable value of land and additions on the property. | Land | Improvement |
|---|---|---|---|---|
| 2025 | $6,913 | $516,700 | $163,000 | $353,700 |
| 2024 | $6,715 | $501,900 | $158,300 | $343,600 |
| 2023 | $5,895 | $415,700 | $158,300 | $257,400 |
| 2022 | $5,730 | $379,700 | $143,900 | $235,800 |
| 2021 | $4,438 | $293,900 | $138,400 | $155,500 |
| 2020 | $4,499 | $294,600 | $141,100 | $153,500 |
| 2019 | $4,376 | $281,800 | $138,400 | $143,400 |
| 2018 | $4,337 | $274,000 | $133,100 | $140,900 |
| 2017 | $4,219 | $264,000 | $126,700 | $137,300 |
| 2016 | $4,272 | $258,100 | $126,700 | $131,400 |
| 2015 | $4,072 | $255,800 | $126,700 | $129,100 |
Source: Public Records
Map
Nearby Homes
- 438 Maquan St
- Lot 6 Way
- Lot 2 Harvard Rd
- 109 Richard Rd
- 29 Bayberry Rd
- 52 Richard Rd
- 479 Main St
- 145 Gorwin Dr
- 161 Winter St Unit 24
- 166 Pine Grove Ave
- 269 Lakeside Rd
- 125 Independence Ave
- 20 Carol Ave
- 42 Taylor Point Rd
- 1054 Main St
- 36 Meadow Ln
- 456 Gorwin Dr
- 80 Phillips St
- 72 Phillips St
- 26 Stonebridge Dr
- 40 Cranberry Rd
- 515 Indian Head St
- 492 Indian Head St
- 477 Indian Head St
- 502 Indian Head St
- 71 Cranberry Rd
- 531 Indian Head St
- 457 Indian Head St
- 63 Cranberry Rd
- 41 Ransom Rd
- 41 Ransom Rd
- 552 Indian Head St
- 472 Indian Head St
- 472B Indian Head St
- 435 Indian Head St
- 448 Indian Head St
- 61 Ransom Rd
- 571 Indian Head St
- 83 Ransom Rd
- 19 Katy Did Ln