Estimated Value: $213,000 - $247,000
--
Bed
--
Bath
1,152
Sq Ft
$198/Sq Ft
Est. Value
About This Home
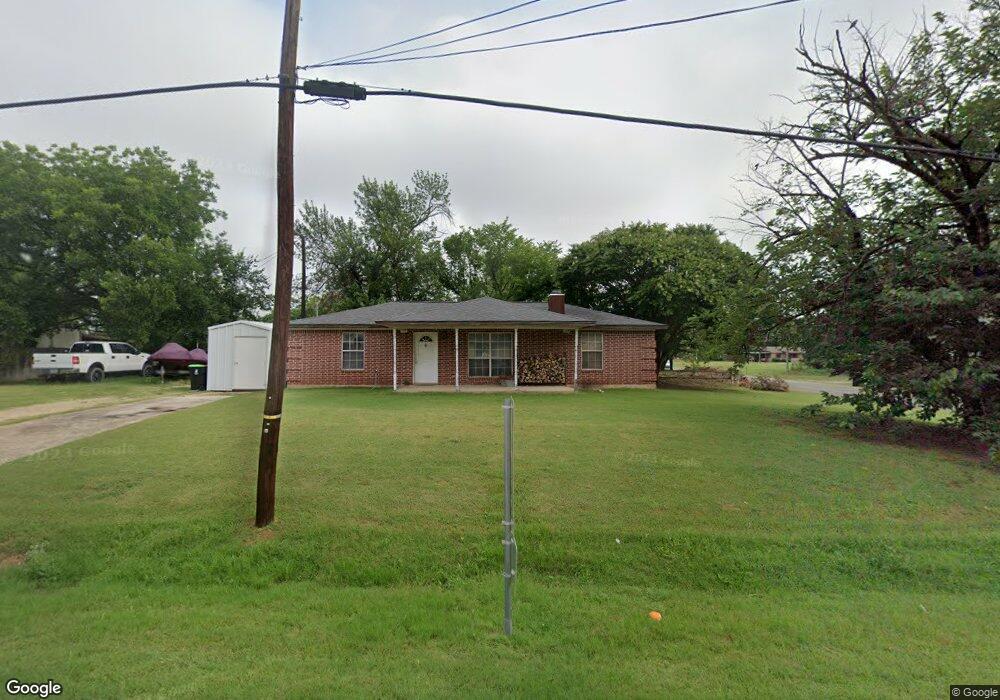
This home is located at 501 Knox Ave, Boyd, TX 76023 and is currently estimated at $228,334, approximately $198 per square foot. 501 Knox Ave is a home located in Wise County with nearby schools including Boyd Elementary School, Boyd Middle School, and Boyd High School.
Ownership History
Date
Name
Owned For
Owner Type
Purchase Details
Closed on
May 28, 2003
Sold by
Usa Housing & Urban Developmen
Bought by
Pitts Thomas
Current Estimated Value
Purchase Details
Closed on
Mar 4, 2003
Sold by
Mortgage Electronic
Bought by
Pitts Thomas
Purchase Details
Closed on
Sep 11, 2002
Sold by
Garrett Kelley G and Garrett Grant
Bought by
Pitts Thomas
Purchase Details
Closed on
May 3, 2000
Sold by
Federal National Mortgage Asn
Bought by
Pitts Thomas
Purchase Details
Closed on
Apr 10, 2000
Sold by
Bricker Joel E and Bricker Sharon M
Bought by
Pitts Thomas
Purchase Details
Closed on
Jan 31, 1996
Bought by
Pitts Thomas
Purchase Details
Closed on
Apr 25, 1995
Bought by
Pitts Thomas
Purchase Details
Closed on
May 23, 1985
Bought by
Pitts Thomas
Create a Home Valuation Report for This Property
The Home Valuation Report is an in-depth analysis detailing your home's value as well as a comparison with similar homes in the area
Home Values in the Area
Average Home Value in this Area
Purchase History
| Date | Buyer | Sale Price | Title Company |
|---|---|---|---|
| Pitts Thomas | -- | -- | |
| Pitts Thomas | -- | -- | |
| Pitts Thomas | -- | -- | |
| Pitts Thomas | -- | -- | |
| Pitts Thomas | -- | -- | |
| Pitts Thomas | -- | -- | |
| Pitts Thomas | -- | -- | |
| Pitts Thomas | -- | -- |
Source: Public Records
Tax History Compared to Growth
Tax History
| Year | Tax Paid | Tax Assessment Tax Assessment Total Assessment is a certain percentage of the fair market value that is determined by local assessors to be the total taxable value of land and additions on the property. | Land | Improvement |
|---|---|---|---|---|
| 2025 | $2,070 | $195,599 | -- | -- |
| 2024 | $2,070 | $160,717 | $0 | $0 |
| 2023 | $2,711 | $146,106 | $0 | $0 |
| 2022 | $3,144 | $146,504 | $21,875 | $124,629 |
| 2021 | $2,687 | $120,750 | $21,880 | $98,870 |
| 2020 | $2,574 | $115,250 | $21,880 | $93,370 |
| 2019 | $2,499 | $108,750 | $17,500 | $91,250 |
| 2018 | $2,225 | $95,540 | $8,750 | $86,790 |
| 2017 | $2,132 | $89,030 | $8,750 | $80,280 |
| 2016 | $2,073 | $86,540 | $8,750 | $77,790 |
| 2015 | -- | $80,550 | $8,750 | $71,800 |
| 2014 | -- | $81,340 | $8,750 | $72,590 |
Source: Public Records
Map
Nearby Homes
- tbd S Oak St
- 207 W Morton Ave
- 3397 2048 Hwy
- 100 N Agnew St
- 420 S Evans St
- 18 Acres Highway 114 Rd
- 405 Edgewood Terrace
- 205 S Allen St
- 213 S Allen St
- 110 Gerber Ln
- 213 S Hitt St
- 525 Highway 114 Rd
- TBD S Atwood
- 113 N Wilson St
- 132 Ivy Terrace
- 111 Irish Ivy Ct
- AMBER Plan at Springhill South
- NATCHEZ Plan at Springhill South
- HANNA Plan at Springhill South
- TUPELO Plan at Springhill South