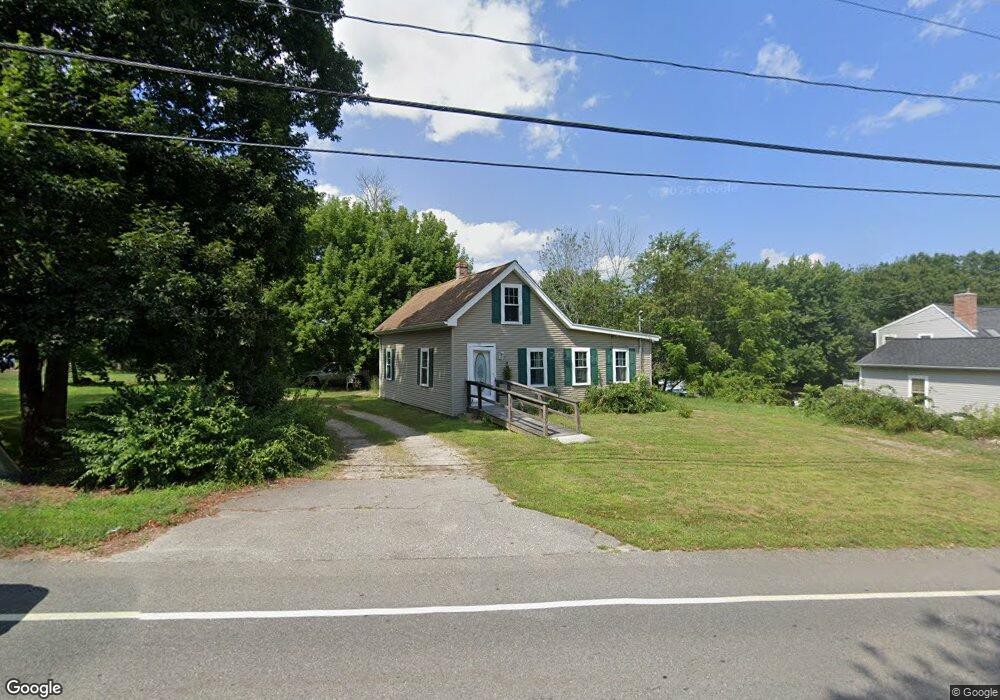
501 Locust St Swansea, MA 02777
West Swansea NeighborhoodEstimated Value: $398,000 - $472,000
3
Beds
1
Bath
1,035
Sq Ft
$428/Sq Ft
Est. Value
About This Home
This home is located at 501 Locust St, Swansea, MA 02777 and is currently estimated at $442,948, approximately $427 per square foot. 501 Locust St is a home located in Bristol County with nearby schools including Joseph Case High School and Swansea Wood School.
Ownership History
Date
Name
Owned For
Owner Type
Purchase Details
Closed on
Feb 16, 2024
Sold by
Santana Beatrice E Est and Mello
Bought by
Mello Sherry A and Matton Priscilla C
Current Estimated Value
Purchase Details
Closed on
Oct 30, 1978
Bought by
Santana Margaret E and Santana Beatrice E
Create a Home Valuation Report for This Property
The Home Valuation Report is an in-depth analysis detailing your home's value as well as a comparison with similar homes in the area
Home Values in the Area
Average Home Value in this Area
Purchase History
| Date | Buyer | Sale Price | Title Company |
|---|---|---|---|
| Mello Sherry A | -- | None Available | |
| Santana Margaret E | -- | -- |
Source: Public Records
Mortgage History
| Date | Status | Borrower | Loan Amount |
|---|---|---|---|
| Previous Owner | Santana Margaret E | $116,000 | |
| Previous Owner | Santana Margaret E | $53,000 | |
| Previous Owner | Santana Margaret E | $24,949 | |
| Previous Owner | Santana Margaret E | $12,000 |
Source: Public Records
Tax History Compared to Growth
Tax History
| Year | Tax Paid | Tax Assessment Tax Assessment Total Assessment is a certain percentage of the fair market value that is determined by local assessors to be the total taxable value of land and additions on the property. | Land | Improvement |
|---|---|---|---|---|
| 2025 | $4,732 | $397,000 | $223,000 | $174,000 |
| 2024 | $4,748 | $396,000 | $223,000 | $173,000 |
| 2023 | $4,552 | $346,700 | $176,000 | $170,700 |
| 2022 | $4,245 | $295,000 | $164,300 | $130,700 |
| 2021 | $4,358 | $278,800 | $164,300 | $114,500 |
| 2020 | $4,361 | $279,900 | $164,300 | $115,600 |
| 2019 | $4,205 | $271,100 | $151,700 | $119,400 |
| 2018 | $4,020 | $263,100 | $150,000 | $113,100 |
| 2017 | $3,527 | $265,600 | $150,000 | $115,600 |
| 2016 | $3,108 | $229,900 | $135,700 | $94,200 |
| 2015 | $3,002 | $228,600 | $135,700 | $92,900 |
| 2014 | $2,935 | $228,600 | $135,700 | $92,900 |
Source: Public Records
Map
Nearby Homes
- 283 Plain St
- 51 Sophia Dr
- 50 Sophia Dr
- 49 Sophia Dr
- 7 Johnnies Way
- 850 Hortonville Rd
- 47 Spring St
- 4 Meadowbrook Ave
- 3 Johnnies Way
- 3b Johnnies Way
- 3a Johnnies Way
- 16 Martin St
- 129 Cameron Way
- 383 Vinnicum Rd
- 16 Ashlynn Way
- 0B Cummings Rd
- 0A Cummings Rd
- 75 Martin St
- Lot 11 Lynch
- 0 Proprietors Way Unit 73324662