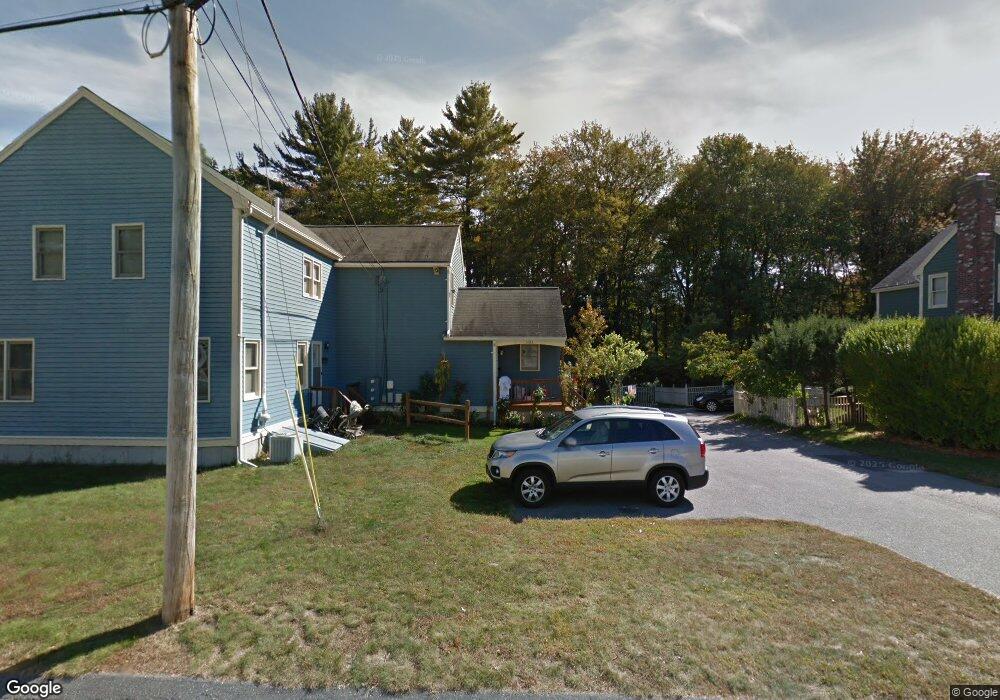
501 Lords Ct Wilmington, MA 01887
Estimated Value: $426,129 - $686,000
2
Beds
2
Baths
1,076
Sq Ft
$509/Sq Ft
Est. Value
About This Home
This home is located at 501 Lords Ct, Wilmington, MA 01887 and is currently estimated at $547,282, approximately $508 per square foot. 501 Lords Ct is a home located in Middlesex County with nearby schools including Wilmington Middle School and Wilmington High School.
Ownership History
Date
Name
Owned For
Owner Type
Purchase Details
Closed on
Nov 27, 2013
Sold by
Sullivan Dorothy A and Sullivan Robert P
Bought by
Manrique Alberto G
Current Estimated Value
Purchase Details
Closed on
Jul 21, 2003
Sold by
Biasella Patricia E and Timilty Patricia E
Bought by
Biasella Armando
Home Financials for this Owner
Home Financials are based on the most recent Mortgage that was taken out on this home.
Original Mortgage
$55,000
Interest Rate
5.34%
Purchase Details
Closed on
Jan 7, 1992
Sold by
Donell Corp
Bought by
Timulty Patricia E
Home Financials for this Owner
Home Financials are based on the most recent Mortgage that was taken out on this home.
Original Mortgage
$63,750
Interest Rate
8.56%
Mortgage Type
Purchase Money Mortgage
Create a Home Valuation Report for This Property
The Home Valuation Report is an in-depth analysis detailing your home's value as well as a comparison with similar homes in the area
Home Values in the Area
Average Home Value in this Area
Purchase History
| Date | Buyer | Sale Price | Title Company |
|---|---|---|---|
| Manrique Alberto G | $252,000 | -- | |
| Biasella Armando | -- | -- | |
| Timulty Patricia E | $75,000 | -- |
Source: Public Records
Mortgage History
| Date | Status | Borrower | Loan Amount |
|---|---|---|---|
| Previous Owner | Biasella Armando | $55,000 | |
| Previous Owner | Timulty Patricia E | $63,750 |
Source: Public Records
Tax History Compared to Growth
Tax History
| Year | Tax Paid | Tax Assessment Tax Assessment Total Assessment is a certain percentage of the fair market value that is determined by local assessors to be the total taxable value of land and additions on the property. | Land | Improvement |
|---|---|---|---|---|
| 2025 | $3,427 | $299,300 | $134,300 | $165,000 |
| 2024 | $3,327 | $291,100 | $134,300 | $156,800 |
| 2023 | $3,177 | $266,100 | $122,100 | $144,000 |
| 2022 | $3,183 | $244,300 | $101,800 | $142,500 |
| 2021 | $3,034 | $219,200 | $92,500 | $126,700 |
| 2020 | $2,852 | $210,000 | $154,200 | $55,800 |
| 2019 | $2,888 | $210,000 | $146,800 | $63,200 |
| 2018 | $3,026 | $210,000 | $139,800 | $70,200 |
| 2017 | $3,035 | $210,000 | $133,200 | $76,800 |
| 2016 | $3,072 | $210,000 | $126,800 | $83,200 |
| 2015 | $2,861 | $199,100 | $126,800 | $72,300 |
| 2014 | $2,835 | $199,100 | $120,800 | $78,300 |
Source: Public Records
Map
Nearby Homes