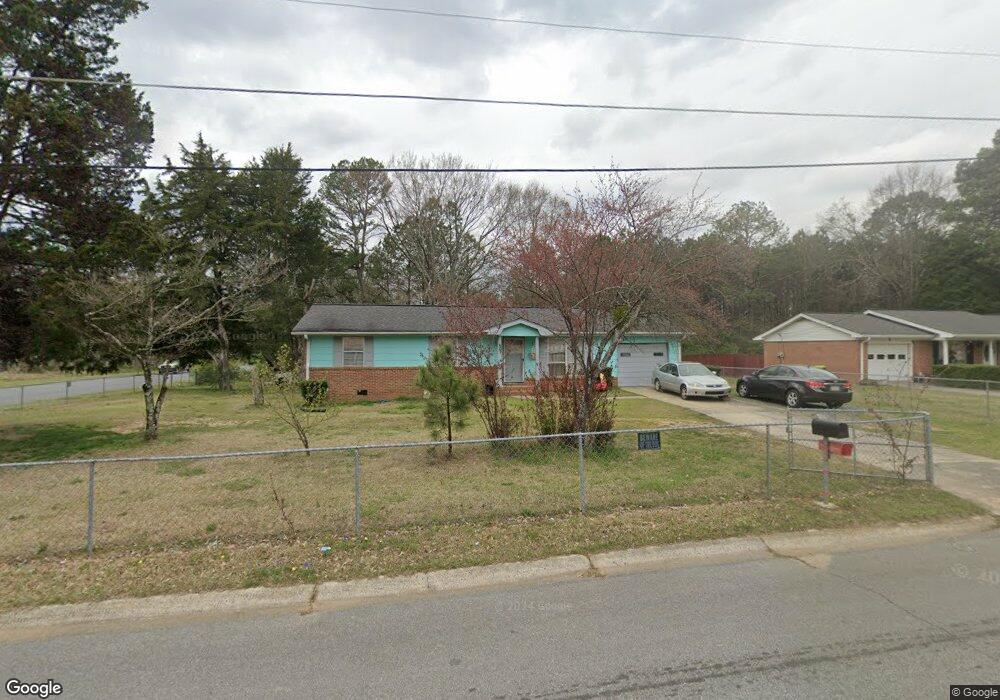
501 Lynton Dr Cedartown, GA 30125
Estimated Value: $145,000 - $190,000
3
Beds
2
Baths
1,125
Sq Ft
$156/Sq Ft
Est. Value
About This Home
This home is located at 501 Lynton Dr, Cedartown, GA 30125 and is currently estimated at $174,947, approximately $155 per square foot. 501 Lynton Dr is a home located in Polk County with nearby schools including Cedar Christian School and Vineyard Harvester Christian Academy.
Ownership History
Date
Name
Owned For
Owner Type
Purchase Details
Closed on
Aug 7, 2001
Sold by
Womack Doris D
Bought by
Perez Moises C
Current Estimated Value
Purchase Details
Closed on
Jan 17, 1991
Sold by
Hicks James N
Bought by
Womack Doris D
Purchase Details
Closed on
Apr 2, 1990
Sold by
Mcdowell Franklin
Bought by
Hicks James N
Purchase Details
Closed on
Mar 21, 1985
Sold by
Mcdowell Franklin H
Bought by
Farmers Home Adm
Purchase Details
Closed on
Aug 16, 1984
Sold by
Reddish Lyvoid
Bought by
Farmers Home Adm
Purchase Details
Closed on
Jan 6, 1984
Bought by
Reddish Lyvoid
Purchase Details
Closed on
Nov 28, 1983
Bought by
Reddish Lyvoid
Purchase Details
Closed on
Jun 11, 1983
Sold by
Farmers Home Adm
Bought by
Reddish Lyvoid
Purchase Details
Closed on
Mar 23, 1982
Sold by
Highfield Thomas A
Bought by
Farmers Home Adm
Purchase Details
Closed on
Nov 3, 1978
Sold by
Brown Robert L
Bought by
Highfield Thomas A
Create a Home Valuation Report for This Property
The Home Valuation Report is an in-depth analysis detailing your home's value as well as a comparison with similar homes in the area
Home Values in the Area
Average Home Value in this Area
Purchase History
| Date | Buyer | Sale Price | Title Company |
|---|---|---|---|
| Perez Moises C | $69,000 | -- | |
| Womack Doris D | $42,000 | -- | |
| Hicks James N | $24,500 | -- | |
| Farmers Home Adm | -- | -- | |
| Farmers Home Adm | -- | -- | |
| Reddish Lyvoid | -- | -- | |
| Reddish Lyvoid | -- | -- | |
| Reddish Lyvoid | -- | -- | |
| Reddish Lyvoid | -- | -- | |
| Farmers Home Adm | -- | -- | |
| Highfield Thomas A | -- | -- |
Source: Public Records
Tax History Compared to Growth
Tax History
| Year | Tax Paid | Tax Assessment Tax Assessment Total Assessment is a certain percentage of the fair market value that is determined by local assessors to be the total taxable value of land and additions on the property. | Land | Improvement |
|---|---|---|---|---|
| 2024 | $1,913 | $61,880 | $5,600 | $56,280 |
| 2023 | $954 | $28,884 | $3,200 | $25,684 |
| 2022 | $553 | $25,297 | $3,200 | $22,097 |
| 2021 | $560 | $25,297 | $3,200 | $22,097 |
| 2020 | $561 | $25,297 | $3,200 | $22,097 |
| 2019 | $600 | $24,336 | $2,760 | $21,576 |
| 2018 | $580 | $23,047 | $2,760 | $20,287 |
| 2017 | $573 | $23,047 | $2,760 | $20,287 |
| 2016 | $573 | $23,047 | $2,760 | $20,287 |
| 2015 | $575 | $23,072 | $2,760 | $20,312 |
| 2014 | $579 | $23,072 | $2,760 | $20,312 |
Source: Public Records
Map
Nearby Homes
- 309 Walnut St
- 605 W Girard Ave
- 258 Chestnut St
- 443 N Cave Spring St
- 305 N Cave Spring St
- 382 5th St
- 293 4th St
- 421 Wissahickon Ave
- 214 Victoria Ave
- 607 N College St
- 408 N College St
- 214 Jule Peek Ave
- 228 Marshall St
- 119 Jackson St
- 144 Marshall St
- 328 Mountain Home Rd
- 601 Mountain Home Rd
- 403 Lakeside Dr
- 521 W John Hand Rd
- 208 Highland Ave
- 0 W Girard Ave Unit 6892076
- 0 W Girard Ave Unit 8987674
- 0 W Girard Ave Unit 8812659
- 0 W Girard Ave Unit 6744761
- W W Girard Ave Unit 16 17
- W W Girard Ave Unit PT Lot 7,8
- W W Girard Ave
- 0 W Girard Ave Unit 6634830
- 0 W Girard Ave Unit 8634479
- W. W Girard Ave
- 0 W Girard Ave
- 500 Lynton Dr
- 505 Lynton Dr
- 823 W Girard Ave
- 509 Lynton Dr
- 810 W Girard Ave
- 819 W Girard Ave
- 504 Lynton Dr
- 508 Lynton Dr
- 513 Lynton Dr