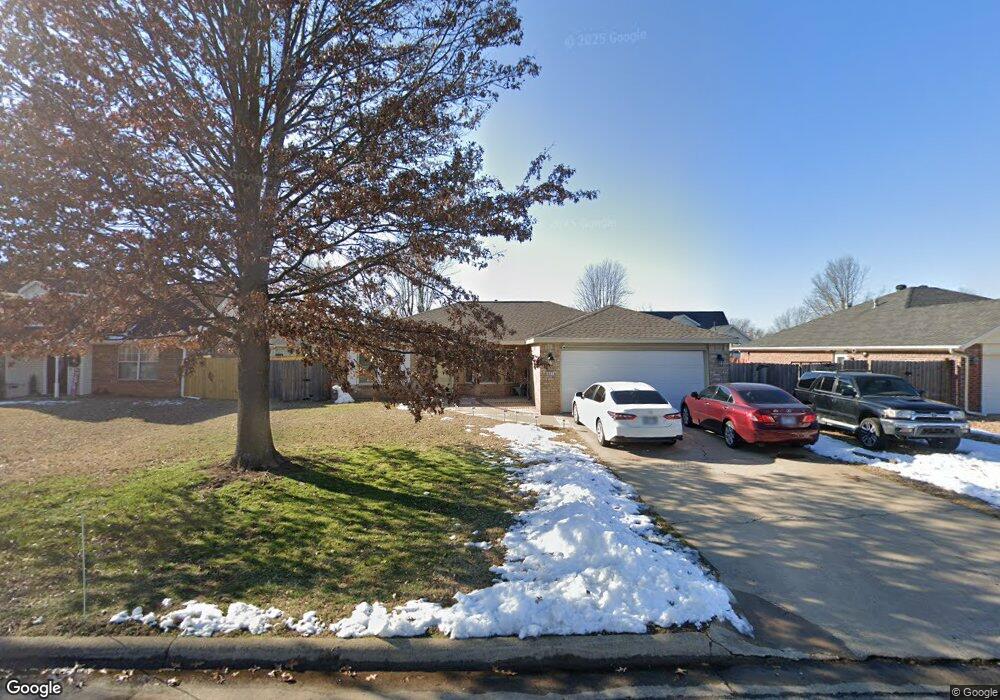
501 Megan St Bentonville, AR 72712
Estimated Value: $350,000 - $458,000
--
Bed
2
Baths
1,423
Sq Ft
$273/Sq Ft
Est. Value
About This Home
This home is located at 501 Megan St, Bentonville, AR 72712 and is currently estimated at $388,086, approximately $272 per square foot. 501 Megan St is a home located in Benton County with nearby schools including Ruth Barker Middle School, Apple Glen Elementary School, and Washington Junior High School.
Ownership History
Date
Name
Owned For
Owner Type
Purchase Details
Closed on
Feb 2, 2005
Sold by
Cavness Justin and Cavness Tammie
Bought by
Carpio Abilio
Current Estimated Value
Home Financials for this Owner
Home Financials are based on the most recent Mortgage that was taken out on this home.
Original Mortgage
$129,000
Outstanding Balance
$65,431
Interest Rate
5.82%
Estimated Equity
$322,655
Purchase Details
Closed on
Sep 8, 2000
Bought by
Cavness
Purchase Details
Closed on
Jan 16, 1996
Bought by
Mabrey Tr
Purchase Details
Closed on
Dec 20, 1995
Bought by
Fehlig
Purchase Details
Closed on
Oct 24, 1995
Bought by
Kdf Inc
Purchase Details
Closed on
Jan 11, 1995
Bought by
Pendergraft
Purchase Details
Closed on
Dec 20, 1994
Bought by
Fehlig
Purchase Details
Closed on
Oct 11, 1993
Bought by
Pendergraft
Create a Home Valuation Report for This Property
The Home Valuation Report is an in-depth analysis detailing your home's value as well as a comparison with similar homes in the area
Home Values in the Area
Average Home Value in this Area
Purchase History
| Date | Buyer | Sale Price | Title Company |
|---|---|---|---|
| Carpio Abilio | $129,000 | None Available | |
| Cavness | $87,000 | -- | |
| Greer | $78,000 | -- | |
| Cavness | -- | -- | |
| Mabrey Tr | $78,000 | -- | |
| Fehlig | $71,000 | -- | |
| Kdf Inc | -- | -- | |
| Pendergraft | -- | -- | |
| Fehlig | -- | -- | |
| Pendergraft | $27,000 | -- |
Source: Public Records
Mortgage History
| Date | Status | Borrower | Loan Amount |
|---|---|---|---|
| Open | Carpio Abilio | $129,000 |
Source: Public Records
Tax History Compared to Growth
Tax History
| Year | Tax Paid | Tax Assessment Tax Assessment Total Assessment is a certain percentage of the fair market value that is determined by local assessors to be the total taxable value of land and additions on the property. | Land | Improvement |
|---|---|---|---|---|
| 2025 | $1,313 | $68,809 | $15,000 | $53,809 |
| 2024 | $1,319 | $68,809 | $15,000 | $53,809 |
| 2023 | $1,319 | $44,090 | $8,600 | $35,490 |
| 2022 | $976 | $44,090 | $8,600 | $35,490 |
| 2021 | $971 | $44,090 | $8,600 | $35,490 |
| 2020 | $984 | $28,810 | $3,800 | $25,010 |
| 2019 | $984 | $28,810 | $3,800 | $25,010 |
| 2018 | $1,009 | $28,810 | $3,800 | $25,010 |
| 2017 | $967 | $28,810 | $3,800 | $25,010 |
| 2016 | $967 | $28,810 | $3,800 | $25,010 |
| 2015 | $1,319 | $21,340 | $4,200 | $17,140 |
| 2014 | $969 | $21,340 | $4,200 | $17,140 |
Source: Public Records
Map
Nearby Homes
- 501 NE Whitney St
- 901 NE Mccollum Dr
- 2801 SE 3rd St
- 2709 Pleasant View Ln
- 2806 SE 3rd St
- 2512 SE 3rd St
- 2708 Pleasant View Ln
- 2504 SE 4th St
- 1210 Rice Rd
- 1210 Spring St
- 1500 Linwood Cir
- 0 Rice Rd Unit 1291234
- 1402 NE Fairwinds Dr
- 1615 Cresent St
- 1303 NE Fairwinds Dr
- Lot 12 Woods Creek Rd
- Lot 14 Woods Creek Rd
- Lot 11 Woods Creek Rd
- Lot 13 Woods Creek Rd
- 3907 NE Cadbury Ave