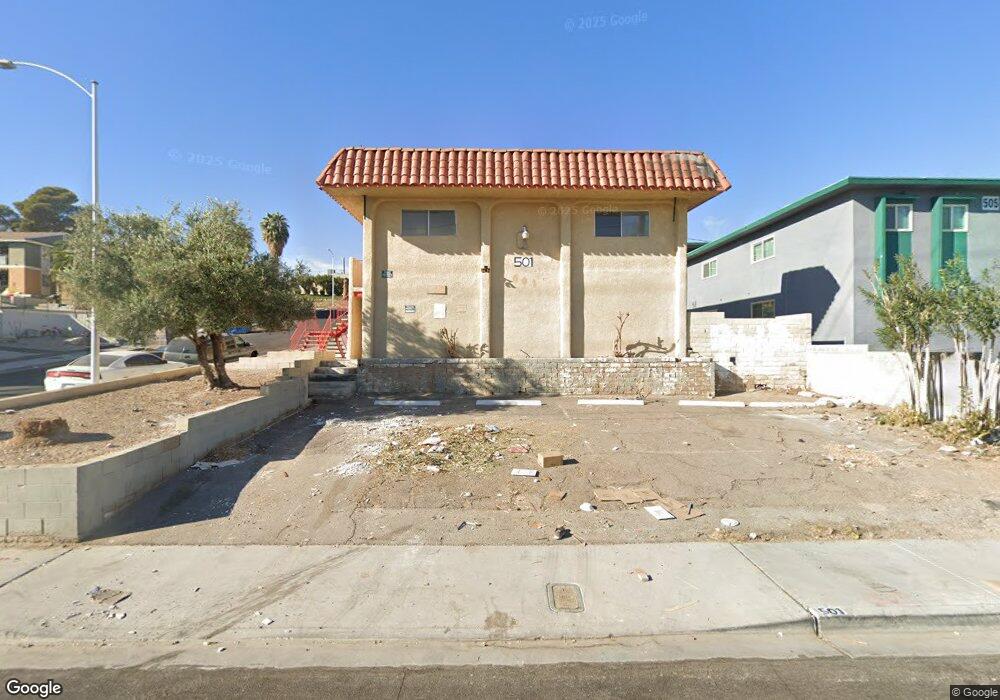
501 N 14th St Las Vegas, NV 89101
Downtown Las Vegas NeighborhoodEstimated Value: $503,000 - $611,000
8
Beds
4
Baths
3,128
Sq Ft
$171/Sq Ft
Est. Value
About This Home
This home is located at 501 N 14th St, Las Vegas, NV 89101 and is currently estimated at $535,178, approximately $171 per square foot. 501 N 14th St is a home located in Clark County with nearby schools including Halle Hewetson Elementary School, J.D. Smith Middle School, and Rancho High School.
Ownership History
Date
Name
Owned For
Owner Type
Purchase Details
Closed on
Apr 4, 2025
Sold by
Lee Kenneth and Lee Grace
Bought by
4 Plumerias Llc-501 N 14Th Protected Series
Current Estimated Value
Purchase Details
Closed on
Sep 16, 2024
Sold by
Martinez Elly M
Bought by
Lee Kenneth and Lee Grace
Home Financials for this Owner
Home Financials are based on the most recent Mortgage that was taken out on this home.
Original Mortgage
$375,750
Interest Rate
6.46%
Mortgage Type
New Conventional
Purchase Details
Closed on
Nov 14, 2006
Sold by
Martinez Huerta Carlos
Bought by
Martinez Elly M
Home Financials for this Owner
Home Financials are based on the most recent Mortgage that was taken out on this home.
Original Mortgage
$340,000
Interest Rate
7.75%
Mortgage Type
Negative Amortization
Purchase Details
Closed on
Oct 5, 1998
Sold by
Sar Leang and So Savinn
Bought by
Sar Hour and Vann Sar Samphoun
Home Financials for this Owner
Home Financials are based on the most recent Mortgage that was taken out on this home.
Original Mortgage
$86,700
Interest Rate
6.88%
Create a Home Valuation Report for This Property
The Home Valuation Report is an in-depth analysis detailing your home's value as well as a comparison with similar homes in the area
Home Values in the Area
Average Home Value in this Area
Purchase History
| Date | Buyer | Sale Price | Title Company |
|---|---|---|---|
| 4 Plumerias Llc-501 N 14Th Protected Series | -- | None Listed On Document | |
| Lee Kenneth | $501,000 | Fidelity National Title | |
| Martinez Elly M | -- | Fidelity National Title | |
| Martinez Elly M | -- | National Title Company | |
| Martinez Elly M | $425,000 | National Title Company | |
| Sar Hour | -- | Land Title |
Source: Public Records
Mortgage History
| Date | Status | Borrower | Loan Amount |
|---|---|---|---|
| Previous Owner | Lee Kenneth | $375,750 | |
| Previous Owner | Martinez Elly M | $340,000 | |
| Previous Owner | Sar Hour | $86,700 |
Source: Public Records
Tax History Compared to Growth
Tax History
| Year | Tax Paid | Tax Assessment Tax Assessment Total Assessment is a certain percentage of the fair market value that is determined by local assessors to be the total taxable value of land and additions on the property. | Land | Improvement |
|---|---|---|---|---|
| 2025 | $2,046 | $78,121 | $43,750 | $34,371 |
| 2024 | $1,895 | $78,121 | $43,750 | $34,371 |
| 2023 | $1,274 | $77,115 | $43,750 | $33,365 |
| 2022 | $1,755 | $67,437 | $35,000 | $32,437 |
| 2021 | $1,625 | $63,042 | $31,500 | $31,542 |
| 2020 | $1,506 | $60,348 | $28,000 | $32,348 |
| 2019 | $1,411 | $53,724 | $21,000 | $32,724 |
| 2018 | $1,347 | $41,081 | $8,925 | $32,156 |
| 2017 | $1,471 | $44,869 | $12,075 | $32,794 |
| 2016 | $1,274 | $44,351 | $9,800 | $34,551 |
| 2015 | $1,270 | $42,891 | $8,400 | $34,491 |
| 2014 | $1,231 | $41,430 | $7,000 | $34,430 |
Source: Public Records
Map
Nearby Homes
- 507 N 15th St
- 0 Thirteenth Unit 2707474
- 416 N 15th St
- 513 N 13th Bldg A St
- 513 N 13th St
- 364 N 13th St
- 362 N 13th St
- 383 N 16th St
- 629 N 16th St
- 377 N 16th St
- 610 N 11th St
- 700 N 14th St
- 367 N 16th St
- 365 N 16th St
- 624 N Bruce St
- 333 N 13th St
- 637 N 11th St
- 1908 Linden Ave
- 1812 Ryan Ave
- 640 N 10th St
- 500 N 13th St Unit 3
- 500 N 13th St
- 500 N 13th St Unit 4
- 500 N 13th St Unit 2
- 500 N 13th St Unit C27
- 500 N 13th St Unit D4
- 500 N 13th St Unit C14
- 500 N 13th St Unit C29
- 500 N 13th St Unit 28
- 445 N 14th St Unit B
- 445 N 14th St Unit D
- 445 N 14th St
- 445 N 14th St Unit A
- 445 N 14th St Unit C
- 520 N 13th St Unit D7
- 444 N 13th St Unit D
- 444 N 13th St Unit B
- 444 N 13th St
- 441 N 14th St Unit B
- 441 N 14th St