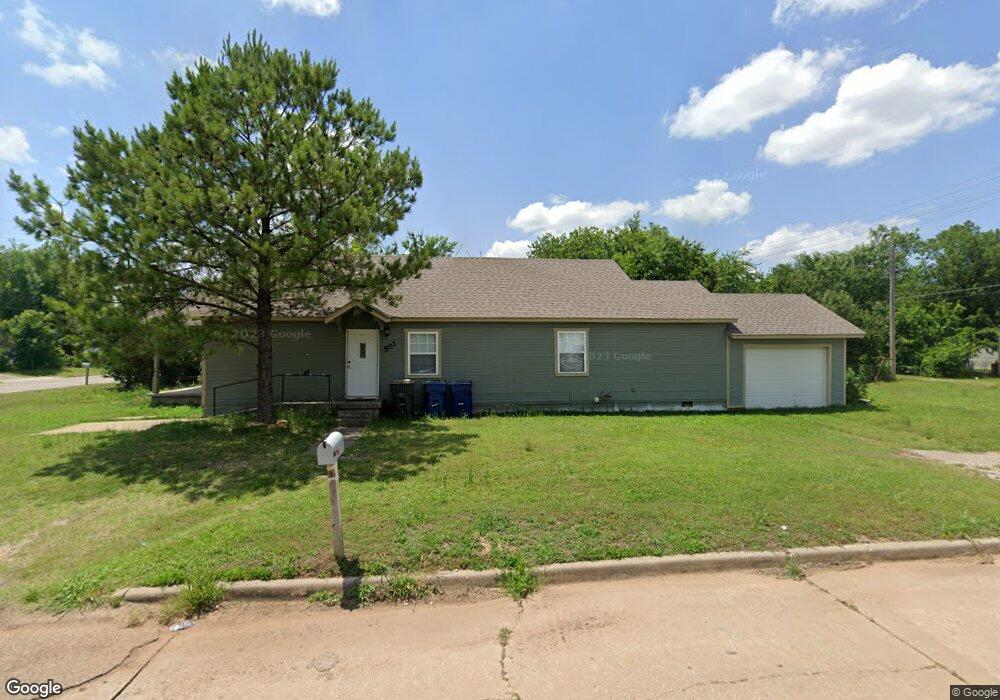
501 N A St Duncan, OK 73533
Estimated Value: $64,000 - $81,000
3
Beds
2
Baths
1,512
Sq Ft
$46/Sq Ft
Est. Value
About This Home
This home is located at 501 N A St, Duncan, OK 73533 and is currently estimated at $69,399, approximately $45 per square foot. 501 N A St is a home located in Stephens County with nearby schools including Woodrow Wilson Elementary School, Duncan Middle School, and Duncan High School.
Ownership History
Date
Name
Owned For
Owner Type
Purchase Details
Closed on
May 3, 2011
Sold by
Jones Billie R and Jones Sheila J
Bought by
Lopez Roy Monterrosa and Monterrosa Maira
Current Estimated Value
Purchase Details
Closed on
Apr 30, 2011
Sold by
Pedraza Eduardo
Bought by
Jones Billie R and Jones Sheila J
Purchase Details
Closed on
May 1, 2006
Sold by
Jones Billie R and Jones Sheila J
Bought by
Pedraza Eduardo and Munoz Luis
Purchase Details
Closed on
Jan 30, 1998
Sold by
Jones Billie R
Purchase Details
Closed on
Mar 8, 1996
Sold by
Fletcher Connie J
Create a Home Valuation Report for This Property
The Home Valuation Report is an in-depth analysis detailing your home's value as well as a comparison with similar homes in the area
Home Values in the Area
Average Home Value in this Area
Purchase History
| Date | Buyer | Sale Price | Title Company |
|---|---|---|---|
| Lopez Roy Monterrosa | $10,000 | None Available | |
| Jones Billie R | -- | None Available | |
| Pedraza Eduardo | $14,000 | None Available | |
| -- | $24,500 | -- | |
| -- | $10,000 | -- |
Source: Public Records
Tax History Compared to Growth
Tax History
| Year | Tax Paid | Tax Assessment Tax Assessment Total Assessment is a certain percentage of the fair market value that is determined by local assessors to be the total taxable value of land and additions on the property. | Land | Improvement |
|---|---|---|---|---|
| 2025 | $323 | $4,822 | $383 | $4,439 |
| 2024 | $314 | $4,682 | $383 | $4,299 |
| 2023 | $314 | $4,682 | $383 | $4,299 |
| 2022 | $290 | $4,413 | $383 | $4,030 |
| 2021 | $313 | $4,679 | $383 | $4,296 |
| 2020 | $286 | $4,311 | $383 | $3,928 |
| 2019 | $264 | $4,049 | $383 | $3,666 |
| 2018 | $291 | $4,265 | $383 | $3,882 |
| 2017 | $179 | $3,079 | $383 | $2,696 |
| 2016 | $258 | $4,034 | $383 | $3,651 |
| 2015 | $222 | $2,519 | $383 | $2,136 |
| 2014 | $222 | $2,519 | $383 | $2,136 |
Source: Public Records
Map
Nearby Homes
- 109 E Chestnut Ave
- 107 E Chestnut Ave
- 201 E Chestnut Ave
- 201 201 E Chestnut
- 417 N A St
- 105 E Chestnut Ave
- 203 E Chestnut Ave
- 505 N A St
- 415 N A St
- 103 E Chestnut Ave
- 205 E Chestnut Ave
- 416 N A St
- 506 N A St
- 507 N A St
- 420 N 1st St
- 413 N A St
- 101 E Chestnut Ave
- 418 N 1st St
- 414 N A St
- 207 E Chestnut Ave