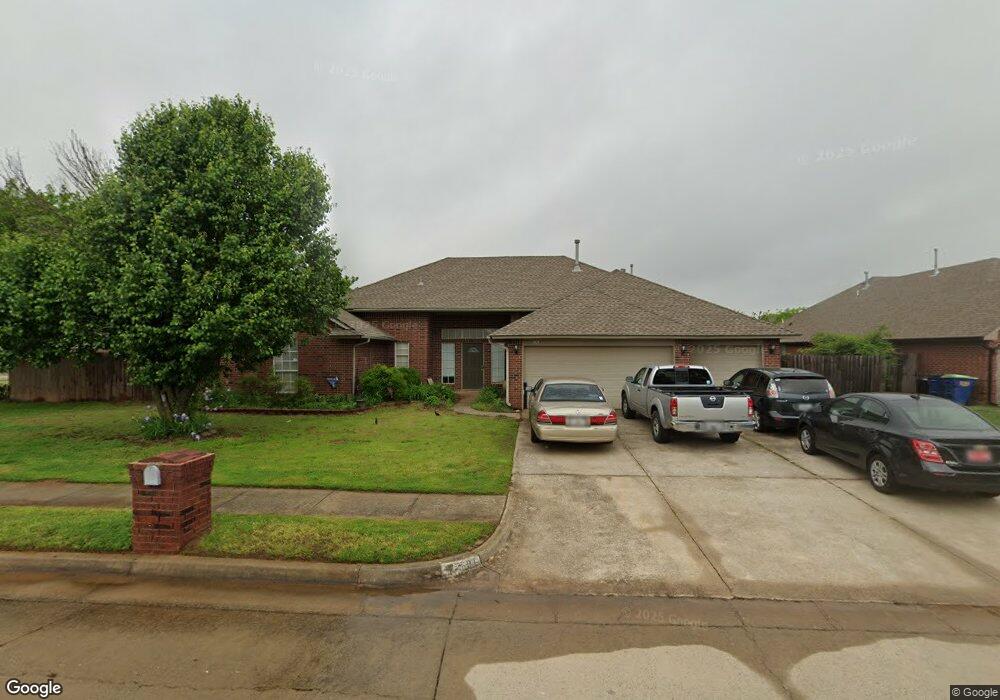
501 N Geronimo Way Mustang, OK 73064
Estimated Value: $273,000 - $295,000
4
Beds
2
Baths
2,111
Sq Ft
$135/Sq Ft
Est. Value
About This Home
This home is located at 501 N Geronimo Way, Mustang, OK 73064 and is currently estimated at $284,043, approximately $134 per square foot. 501 N Geronimo Way is a home located in Canadian County with nearby schools including Mustang Lakehoma Elementary School, Mustang Horizon Intermediate School, and Mustang Middle School.
Ownership History
Date
Name
Owned For
Owner Type
Purchase Details
Closed on
Aug 7, 2017
Sold by
Owen David H and Owen Shannon C
Bought by
Arco Juan Del
Current Estimated Value
Purchase Details
Closed on
Jun 28, 2007
Sold by
Coy League Homes Inc
Bought by
Owen David H and Owen Shannon C
Home Financials for this Owner
Home Financials are based on the most recent Mortgage that was taken out on this home.
Original Mortgage
$170,590
Interest Rate
6.19%
Mortgage Type
VA
Purchase Details
Closed on
Feb 9, 2007
Sold by
Oommen Jolly and Oommen Vergis T
Bought by
Coy League Homes Inc
Purchase Details
Closed on
Mar 31, 1998
Sold by
Bridle Creek Homes Llc
Purchase Details
Closed on
Sep 17, 1997
Sold by
Gary Owens Carpet & Const Inc
Purchase Details
Closed on
Mar 28, 1996
Sold by
Owens Gary and Owens Terri
Purchase Details
Closed on
Sep 8, 1993
Sold by
Owens Dale and Owens Sharon
Create a Home Valuation Report for This Property
The Home Valuation Report is an in-depth analysis detailing your home's value as well as a comparison with similar homes in the area
Home Values in the Area
Average Home Value in this Area
Purchase History
| Date | Buyer | Sale Price | Title Company |
|---|---|---|---|
| Arco Juan Del | $150,000 | None Available | |
| Owen David H | $125,250 | None Available | |
| Coy League Homes Inc | $123,750 | None Available | |
| -- | $116,700 | -- | |
| -- | $20,300 | -- | |
| -- | -- | -- | |
| -- | -- | -- |
Source: Public Records
Mortgage History
| Date | Status | Borrower | Loan Amount |
|---|---|---|---|
| Previous Owner | Owen David H | $170,590 |
Source: Public Records
Tax History Compared to Growth
Tax History
| Year | Tax Paid | Tax Assessment Tax Assessment Total Assessment is a certain percentage of the fair market value that is determined by local assessors to be the total taxable value of land and additions on the property. | Land | Improvement |
|---|---|---|---|---|
| 2024 | $2,375 | $24,995 | $2,537 | $22,458 |
| 2023 | $2,375 | $23,805 | $2,453 | $21,352 |
| 2022 | $2,289 | $22,672 | $2,340 | $20,332 |
| 2021 | $2,189 | $21,592 | $2,340 | $19,252 |
| 2020 | $2,304 | $22,584 | $2,340 | $20,244 |
| 2019 | $2,201 | $21,577 | $2,340 | $19,237 |
| 2018 | $2,142 | $20,550 | $2,340 | $18,210 |
| 2017 | $1,991 | $20,322 | $2,340 | $17,982 |
| 2016 | $2,028 | $20,641 | $2,340 | $18,301 |
| 2015 | $2,143 | $20,411 | $2,340 | $18,071 |
| 2014 | $2,143 | $21,639 | $2,340 | $19,299 |
Source: Public Records
Map
Nearby Homes
- 601 N Chisholm Trail Way
- 608 N Remington Way
- 500 N Remington Way
- 304 N Geronimo Way
- 0 N Czech Hall Rd
- 557 W Pine Rose Court Way
- 912 N Barn Hill Way
- 534 W Pine Rose Court Way
- 805 W Old Farm Way
- 531 W Shadow Ridge Way
- 913 N Kirk Way
- 413 W Pines Way
- 338 W Crooked Branch Way
- 844 W Forest Dr
- 313 N Shannon Way
- 1250 N Tea Olive Way
- 1401 N Golden Bell Way
- 101 N Shannon Way
- 1408 N Golden Bell Way
- 1308 W Harvard Way
- 505 N Geronimo Way
- 805 W Dorchester Way
- 500 N Geronimo Way
- 509 N Geronimo Way
- 504 N Geronimo Way
- 809 W Dorchester Way
- 413 N Geronimo Way
- 508 N Geronimo Way
- 513 N Geronimo Way
- 412 N Sam Houston
- 412 N Geronimo Way
- 412 Sam Houston Way
- 512 N Geronimo Way
- 520 N Caddell Way
- 409 N Geronimo Way
- 713 W Dorchester Way
- 505 N Chisholm Trail Way
- 600 N Caddell Way
- 408 Sam Houston Way
- 408 N Geronimo Way