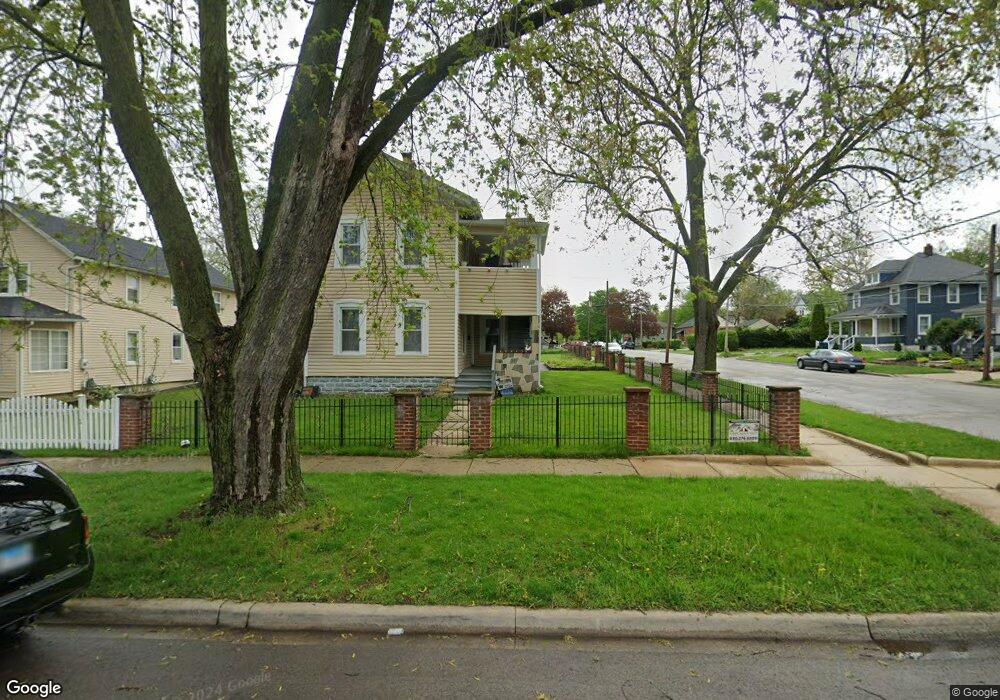
501 N May St Aurora, IL 60506
Near West Galena NeighborhoodEstimated Value: $285,000 - $306,000
5
Beds
--
Bath
2,074
Sq Ft
$142/Sq Ft
Est. Value
About This Home
This home is located at 501 N May St, Aurora, IL 60506 and is currently estimated at $295,306, approximately $142 per square foot. 501 N May St is a home located in Kane County with nearby schools including Greenman Elementary School, Washington Middle School, and West Aurora High School.
Ownership History
Date
Name
Owned For
Owner Type
Purchase Details
Closed on
Aug 27, 1994
Sold by
Rodriguez Juan and Rodriguez Maria
Bought by
Rodriguez Juan and Rodriguez Maria
Current Estimated Value
Home Financials for this Owner
Home Financials are based on the most recent Mortgage that was taken out on this home.
Original Mortgage
$55,000
Interest Rate
8.59%
Create a Home Valuation Report for This Property
The Home Valuation Report is an in-depth analysis detailing your home's value as well as a comparison with similar homes in the area
Home Values in the Area
Average Home Value in this Area
Purchase History
| Date | Buyer | Sale Price | Title Company |
|---|---|---|---|
| Rodriguez Juan | -- | First Midwest Title Svcs Inc |
Source: Public Records
Mortgage History
| Date | Status | Borrower | Loan Amount |
|---|---|---|---|
| Closed | Rodriguez Juan | $55,000 |
Source: Public Records
Tax History Compared to Growth
Tax History
| Year | Tax Paid | Tax Assessment Tax Assessment Total Assessment is a certain percentage of the fair market value that is determined by local assessors to be the total taxable value of land and additions on the property. | Land | Improvement |
|---|---|---|---|---|
| 2024 | $4,540 | $73,340 | $7,955 | $65,385 |
| 2023 | $4,242 | $65,529 | $7,108 | $58,421 |
| 2022 | $4,319 | $59,789 | $6,485 | $53,304 |
| 2021 | $4,081 | $55,665 | $6,038 | $49,627 |
| 2020 | $3,811 | $51,704 | $5,608 | $46,096 |
| 2019 | $3,609 | $47,905 | $5,196 | $42,709 |
| 2018 | $2,928 | $40,330 | $4,806 | $35,524 |
| 2017 | $2,440 | $34,713 | $4,428 | $30,285 |
| 2016 | $1,582 | $30,047 | $3,796 | $26,251 |
| 2015 | -- | $25,371 | $3,264 | $22,107 |
| 2014 | -- | $24,402 | $3,140 | $21,262 |
| 2013 | -- | $31,040 | $3,095 | $27,945 |
Source: Public Records
Map
Nearby Homes
- 519 N View St
- 518 W Park Ave
- 216 N May St
- 208 Blackhawk St
- 111 Blackhawk St
- 932 W New York St
- 808 Gillette Ave
- 516 N Lancaster Ave
- 222 Grand Ave
- 426 Palace St
- 523 W Downer Place
- 616 Morton Ave
- 558 W Downer Place
- 450 W Downer Place Unit C
- 834 Spruce St
- 714 Oak Ave
- 900 Charles St
- 563 California Ave
- 719 Oak Ave
- 211 Cedar St