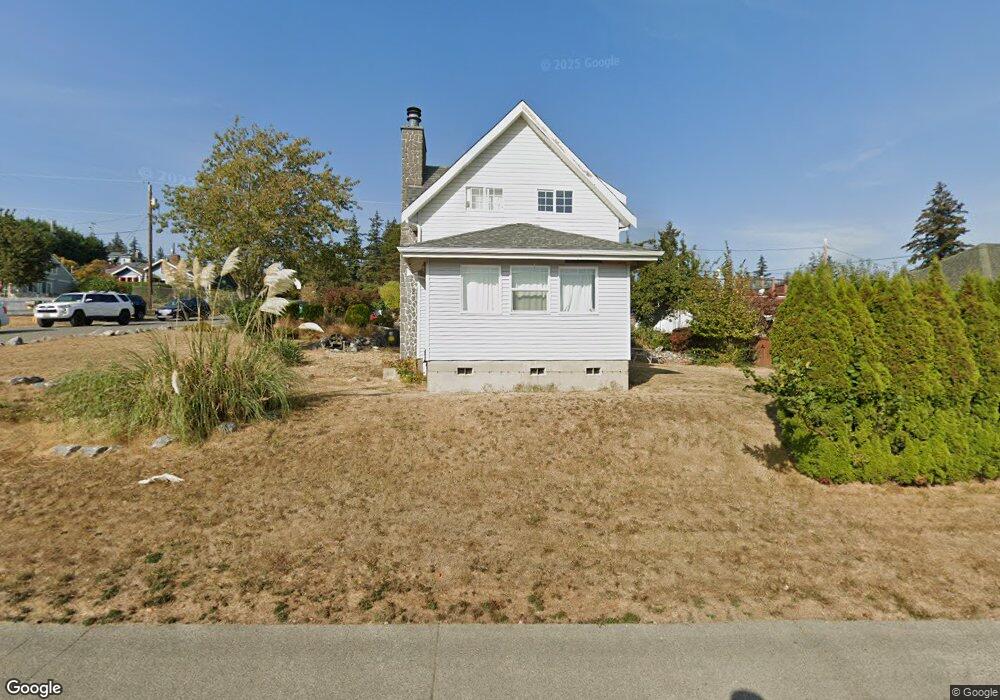
501 N Shore Dr Bellingham, WA 98226
Silver Beach NeighborhoodEstimated Value: $763,135 - $786,000
2
Beds
1
Bath
1,416
Sq Ft
$547/Sq Ft
Est. Value
About This Home
This home is located at 501 N Shore Dr, Bellingham, WA 98226 and is currently estimated at $774,284, approximately $546 per square foot. 501 N Shore Dr is a home located in Whatcom County with nearby schools including Silver Beach Elementary School, Whatcom Middle School, and Squalicum High School.
Ownership History
Date
Name
Owned For
Owner Type
Purchase Details
Closed on
Jan 10, 2018
Sold by
Sheehy Edward J and Sheehy Vita A
Bought by
Strain Eric A and Strain Ami L
Current Estimated Value
Home Financials for this Owner
Home Financials are based on the most recent Mortgage that was taken out on this home.
Original Mortgage
$282,000
Outstanding Balance
$237,731
Interest Rate
3.9%
Mortgage Type
New Conventional
Estimated Equity
$536,553
Purchase Details
Closed on
Apr 26, 2007
Sold by
Sheehy Edward J and Sheehy Edward Ej
Bought by
Sheehy Edward J and Sheehy Vita A
Home Financials for this Owner
Home Financials are based on the most recent Mortgage that was taken out on this home.
Original Mortgage
$300,000
Interest Rate
6.87%
Mortgage Type
Purchase Money Mortgage
Purchase Details
Closed on
Jan 26, 2007
Sold by
Leake Clifford C and Leake Karen L
Bought by
Sheehy Edward Ej
Create a Home Valuation Report for This Property
The Home Valuation Report is an in-depth analysis detailing your home's value as well as a comparison with similar homes in the area
Home Values in the Area
Average Home Value in this Area
Purchase History
| Date | Buyer | Sale Price | Title Company |
|---|---|---|---|
| Strain Eric A | $420,000 | Chicago Title Insurance | |
| Sheehy Edward J | -- | First American Title Insuran | |
| Sheehy Edward Ej | $184,000 | None Available |
Source: Public Records
Mortgage History
| Date | Status | Borrower | Loan Amount |
|---|---|---|---|
| Open | Strain Eric A | $282,000 | |
| Previous Owner | Sheehy Edward J | $300,000 |
Source: Public Records
Tax History Compared to Growth
Tax History
| Year | Tax Paid | Tax Assessment Tax Assessment Total Assessment is a certain percentage of the fair market value that is determined by local assessors to be the total taxable value of land and additions on the property. | Land | Improvement |
|---|---|---|---|---|
| 2024 | $5,573 | $685,940 | $336,932 | $349,008 |
| 2023 | $5,573 | $716,102 | $351,747 | $364,355 |
| 2022 | $4,822 | $628,159 | $308,550 | $319,609 |
| 2021 | $4,353 | $519,140 | $255,000 | $264,140 |
| 2020 | $4,209 | $442,304 | $218,078 | $224,226 |
| 2019 | $3,765 | $413,324 | $203,910 | $209,414 |
| 2018 | $3,896 | $370,732 | $182,910 | $187,822 |
| 2017 | $3,389 | $328,027 | $161,840 | $166,187 |
| 2016 | $3,100 | $298,208 | $147,280 | $150,928 |
| 2015 | $3,331 | $283,947 | $140,000 | $143,947 |
| 2014 | -- | $295,191 | $144,480 | $150,711 |
| 2013 | -- | $283,500 | $140,000 | $143,500 |
Source: Public Records
Map
Nearby Homes
- 4020 Academy St
- 4414 Alice St
- 4431 Alice St
- 4055 Springland Ct
- 3700 Alabama St Unit 316
- 2612 Birch St
- 3666 Woodlake Rd
- 2933 Toad Lake Rd
- 2321 Crestline Dr
- 3785 Greenville Place
- 3153 Chandler Pkwy
- 3155 Chandler Pkwy
- 1580 Hillsdale Rd
- 3159 Chandler Pkwy
- 2209 W Birch St
- 1379 Northwood Ct
- 2104 Birch Cir Unit 5C
- 3852 Del Bonita Way
- 3401 E 17th Crest
- 3108 NHN Northshore Rd
- 501 Northshore Dr
- 509 Northshore Dr
- 509 N Shore Dr
- 2812 Martin St
- 419 N Shore Dr
- 515 N Shore Dr
- 2816 Martin St
- 415 Northshore Dr
- 415 N Shore Dr
- 504 Northshore Dr
- 2813 Flint St
- 519 N Shore Dr
- 2817 Martin St
- 2820 Martin St
- 2817 Flint St
- 512 Northshore Dr
- 512 Northshore Dr
- 409 N Shore Dr
- 2824 Martin St
- 2821 Flint St