Estimated Value: $468,444 - $534,000
5
Beds
3
Baths
4,013
Sq Ft
$125/Sq Ft
Est. Value
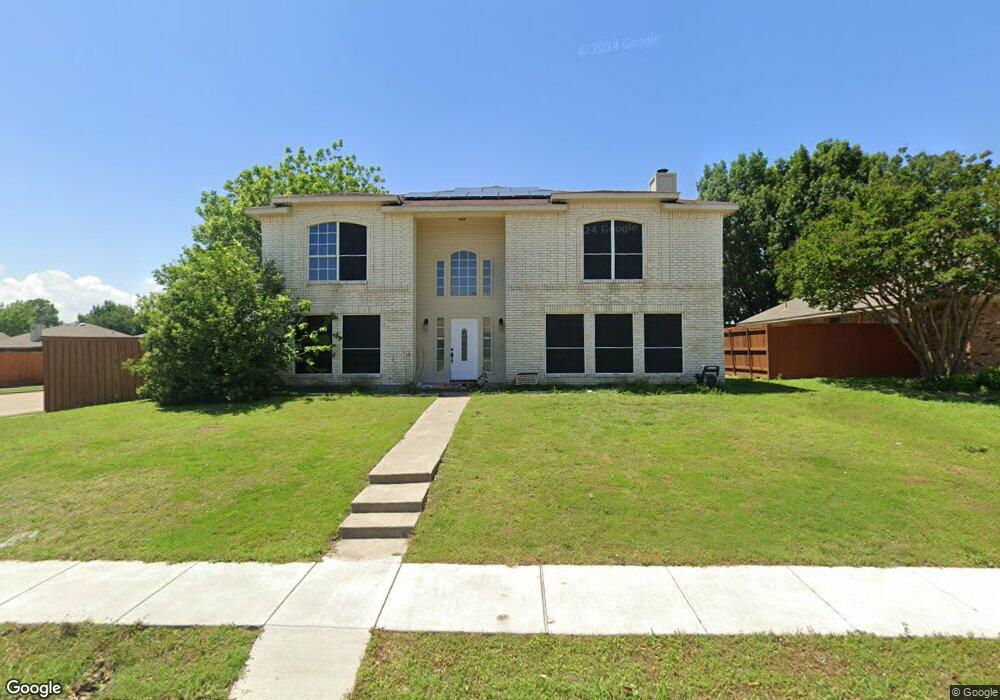
About This Home
This home is located at 501 N Winding Oaks Dr, Wylie, TX 75098 and is currently estimated at $500,111, approximately $124 per square foot. 501 N Winding Oaks Dr is a home located in Collin County with nearby schools including T.F. Birmingham Elementary School, Frank Mcmillan Junior High School, and Davis Intermediate School.
Ownership History
Date
Name
Owned For
Owner Type
Purchase Details
Closed on
Sep 4, 2020
Sold by
Coca Carmen
Bought by
Sides Weston
Current Estimated Value
Home Financials for this Owner
Home Financials are based on the most recent Mortgage that was taken out on this home.
Original Mortgage
$340,500
Outstanding Balance
$302,726
Interest Rate
3%
Mortgage Type
VA
Estimated Equity
$197,385
Purchase Details
Closed on
Oct 28, 2008
Sold by
Mcbride Mary Theresa
Bought by
Coca Carmen
Purchase Details
Closed on
Dec 17, 1996
Sold by
United Homecraft Corp
Bought by
Mcbride Robert and Mcbride Anne
Purchase Details
Closed on
Nov 16, 1995
Sold by
Thrailkill W B
Bought by
United Homecraft Corp
Home Financials for this Owner
Home Financials are based on the most recent Mortgage that was taken out on this home.
Original Mortgage
$90,825
Interest Rate
7.48%
Create a Home Valuation Report for This Property
The Home Valuation Report is an in-depth analysis detailing your home's value as well as a comparison with similar homes in the area
Home Values in the Area
Average Home Value in this Area
Purchase History
| Date | Buyer | Sale Price | Title Company |
|---|---|---|---|
| Sides Weston | -- | Lawyers Title | |
| Coca Carmen | -- | Rtt | |
| Mcbride Robert | -- | -- | |
| United Homecraft Corp | -- | -- |
Source: Public Records
Mortgage History
| Date | Status | Borrower | Loan Amount |
|---|---|---|---|
| Open | Sides Weston | $340,500 | |
| Previous Owner | United Homecraft Corp | $90,825 |
Source: Public Records
Tax History Compared to Growth
Tax History
| Year | Tax Paid | Tax Assessment Tax Assessment Total Assessment is a certain percentage of the fair market value that is determined by local assessors to be the total taxable value of land and additions on the property. | Land | Improvement |
|---|---|---|---|---|
| 2025 | $7,186 | $434,772 | $85,000 | $349,772 |
| 2024 | $7,186 | $442,402 | $85,000 | $357,402 |
| 2023 | $7,186 | $405,350 | $85,000 | $408,463 |
| 2022 | $8,085 | $368,500 | $70,000 | $384,940 |
| 2021 | $7,882 | $335,000 | $70,000 | $265,000 |
| 2020 | $8,593 | $346,088 | $55,000 | $291,088 |
| 2019 | $9,112 | $346,747 | $55,000 | $291,747 |
| 2018 | $7,200 | $267,342 | $55,000 | $212,342 |
| 2017 | $6,666 | $247,531 | $50,000 | $197,531 |
| 2016 | $6,585 | $237,003 | $35,000 | $202,003 |
| 2015 | $4,732 | $181,964 | $30,000 | $151,964 |
Source: Public Records
Map
Nearby Homes
- 423 N Winding Oaks Dr
- 410 N Winding Oaks Dr
- 517 E Gaston Dr
- 502 E Gaston Dr
- 605 Graham Ct
- 415 Carver Dr
- 309 Sikorsky Ct
- 410 Oxford Dr
- 307 W Brown St
- 514 Brighton Ct
- 404 W Jefferson St
- 500 Parker Rd
- 550 Parker Rd
- 705 Baldwin Rd
- 121 Fairmount Dr
- 111 N Keefer Dr
- 115 Pullman Place
- 107 N Winding Oaks Dr
- 420 W Oak St
- 713 Kinston Ct
- 503 N Winding Oaks Dr
- 429 N Winding Oaks Dr
- 429 N Winding Oaks Dr
- 500 Kylie Ln
- 505 N Winding Oaks Dr
- 502 Kylie Ln
- 500 N Winding Oaks Dr
- 502 N Winding Oaks Dr
- 427 N Winding Oaks Dr
- 504 Kylie Ln
- 428 N Winding Oaks Dr
- 504 N Winding Oaks Dr
- 507 N Winding Oaks Dr
- 426 Kylie Ln
- 425 N Winding Oaks Dr
- 426 N Winding Oaks Dr
- 506 Kylie Ln
- 424 Kylie Ln
- 506 N Winding Oaks Dr
- 424 N Winding Oaks Dr