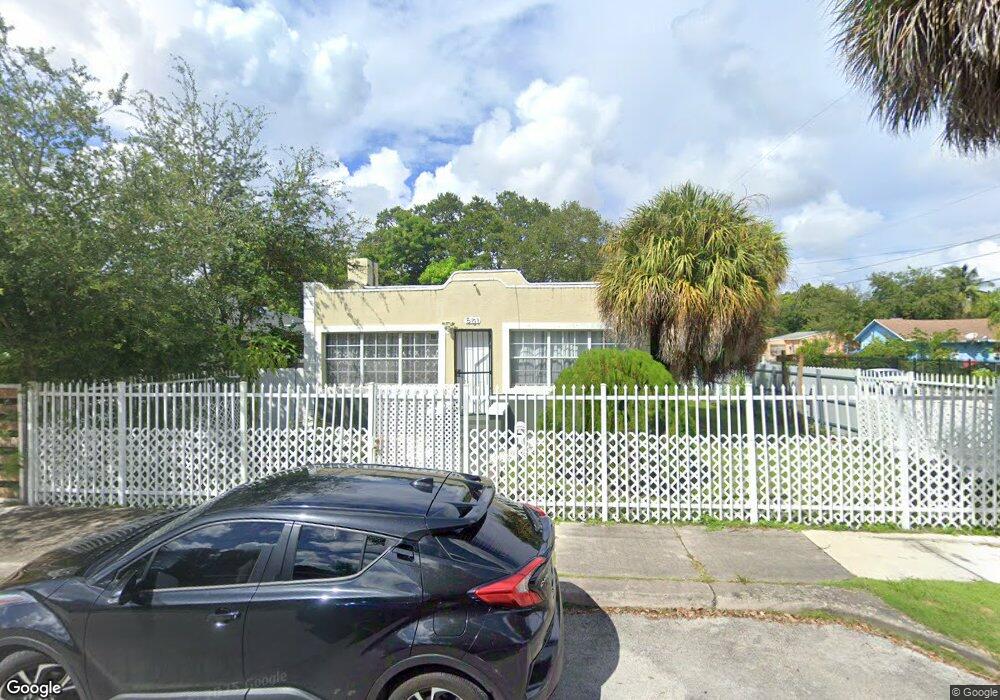
501 NW 56th St Miami, FL 33127
Little Haiti NeighborhoodEstimated Value: $393,000 - $571,000
2
Beds
1
Bath
1,374
Sq Ft
$348/Sq Ft
Est. Value
About This Home
This home is located at 501 NW 56th St, Miami, FL 33127 and is currently estimated at $477,825, approximately $347 per square foot. 501 NW 56th St is a home located in Miami-Dade County with nearby schools including Toussaint L'Ouverture Elementary, Jose De Diego Middle School, and Miami Edison Senior High School.
Ownership History
Date
Name
Owned For
Owner Type
Purchase Details
Closed on
Jan 14, 2005
Sold by
United Development Communities Inc
Bought by
Kamba Sokoloni F
Current Estimated Value
Home Financials for this Owner
Home Financials are based on the most recent Mortgage that was taken out on this home.
Original Mortgage
$137,000
Outstanding Balance
$68,574
Interest Rate
5.62%
Mortgage Type
Unknown
Estimated Equity
$409,251
Purchase Details
Closed on
Apr 8, 2004
Sold by
Hud
Bought by
United Development Communities Inc
Home Financials for this Owner
Home Financials are based on the most recent Mortgage that was taken out on this home.
Original Mortgage
$36,400
Interest Rate
5.88%
Mortgage Type
Stand Alone First
Purchase Details
Closed on
Nov 10, 2003
Sold by
Aurora Loan Services Inc
Bought by
Hud
Purchase Details
Closed on
Apr 23, 2003
Sold by
Camacho Anglae
Bought by
Aurora Loan Services Inc
Purchase Details
Closed on
Feb 1, 2002
Sold by
Marie A Silver I
Bought by
Camacho Anglae
Purchase Details
Closed on
Oct 16, 2001
Sold by
Sandra C Rinker I
Bought by
Silver Marie A
Create a Home Valuation Report for This Property
The Home Valuation Report is an in-depth analysis detailing your home's value as well as a comparison with similar homes in the area
Home Values in the Area
Average Home Value in this Area
Purchase History
| Date | Buyer | Sale Price | Title Company |
|---|---|---|---|
| Kamba Sokoloni F | $137,000 | Lawyers Advantage Title Grou | |
| United Development Communities Inc | $100,500 | Lawyers Advantage Title Grou | |
| Hud | -- | -- | |
| Aurora Loan Services Inc | -- | -- | |
| Camacho Anglae | $89,900 | -- | |
| Silver Marie A | $45,000 | -- |
Source: Public Records
Mortgage History
| Date | Status | Borrower | Loan Amount |
|---|---|---|---|
| Open | Kamba Sokoloni F | $137,000 | |
| Previous Owner | United Development Communities Inc | $36,400 | |
| Closed | United Development Communities Inc | $78,600 |
Source: Public Records
Tax History Compared to Growth
Tax History
| Year | Tax Paid | Tax Assessment Tax Assessment Total Assessment is a certain percentage of the fair market value that is determined by local assessors to be the total taxable value of land and additions on the property. | Land | Improvement |
|---|---|---|---|---|
| 2025 | $4,366 | $138,126 | -- | -- |
| 2024 | $4,366 | $123,347 | -- | -- |
| 2023 | $4,083 | $112,134 | $0 | $0 |
| 2022 | $3,389 | $101,940 | $0 | $0 |
| 2021 | $2,946 | $87,230 | $0 | $0 |
| 2020 | $2,645 | $160,113 | $92,198 | $67,915 |
| 2019 | $2,479 | $150,509 | $82,594 | $67,915 |
| 2018 | $2,262 | $141,149 | $74,911 | $66,238 |
| 2017 | $2,101 | $59,580 | $0 | $0 |
| 2016 | $1,775 | $54,164 | $0 | $0 |
| 2015 | $1,630 | $49,240 | $0 | $0 |
| 2014 | $1,395 | $44,764 | $0 | $0 |
Source: Public Records
Map
Nearby Homes
- 5537 NW 5th Ave
- 5636 NW 4th Ave
- 5511 NW 4th Ave
- 5434 NW 5th Ave
- 5422 NW 5th Ave
- 5428 NW 3rd Ave
- 5709 NW 5th Ct
- 5720 NW 3rd Ave
- 5620 NW 5th Ct
- 5728 NW 5th Ct Unit TH-2
- 5728 NW 5th Ct Unit TH-1
- 279 NW 54th St
- 5743 NW 3rd Ave
- 288 NW 58th St
- 5640 NW 6th Ave
- 412 NW 59th St
- 580 NW 58th St
- 247 NW 54th St
- 415 NW 52nd St
- 561 NW 53rd St
- 500 NW 56th St
- 5538 NW 5th Ave
- 5530 NW 5th Ave Main Front House
- 5530 NW 5th Ave Guest House
- 5530 NW 5th Ave
- 534 NW 56th St
- 5593 NW 5th Ct
- 5595 NW 5th Ct
- 511 NW 56th St
- 5537 NW 5th Ave Unit B
- 521 NW 56th St
- 5525 NW 5th Ct
- 5624 NW 5th Ave Unit Whole Villa
- 5624 NW 5th Ave
- 5550 NW 5th Ct
- 529 NW 56th St
- 5601 NW 5th Ave
- 5535 NW 5th Ave
- 5515 NW 5th Ct
- 426 NW 56th St